Categories
AI Predictive Maintenance Energy Efficiency
When Steel Plants Run Smooth… and Still Lose Millions

When Steel Plants Run Smooth…
and Still Lose Millions How prescriptive maintenance and Condition Monitoring Catch the Process Faults That DCS Alarms Miss

Read Time: 8–9 minutes | Author – Kalyan Meduri
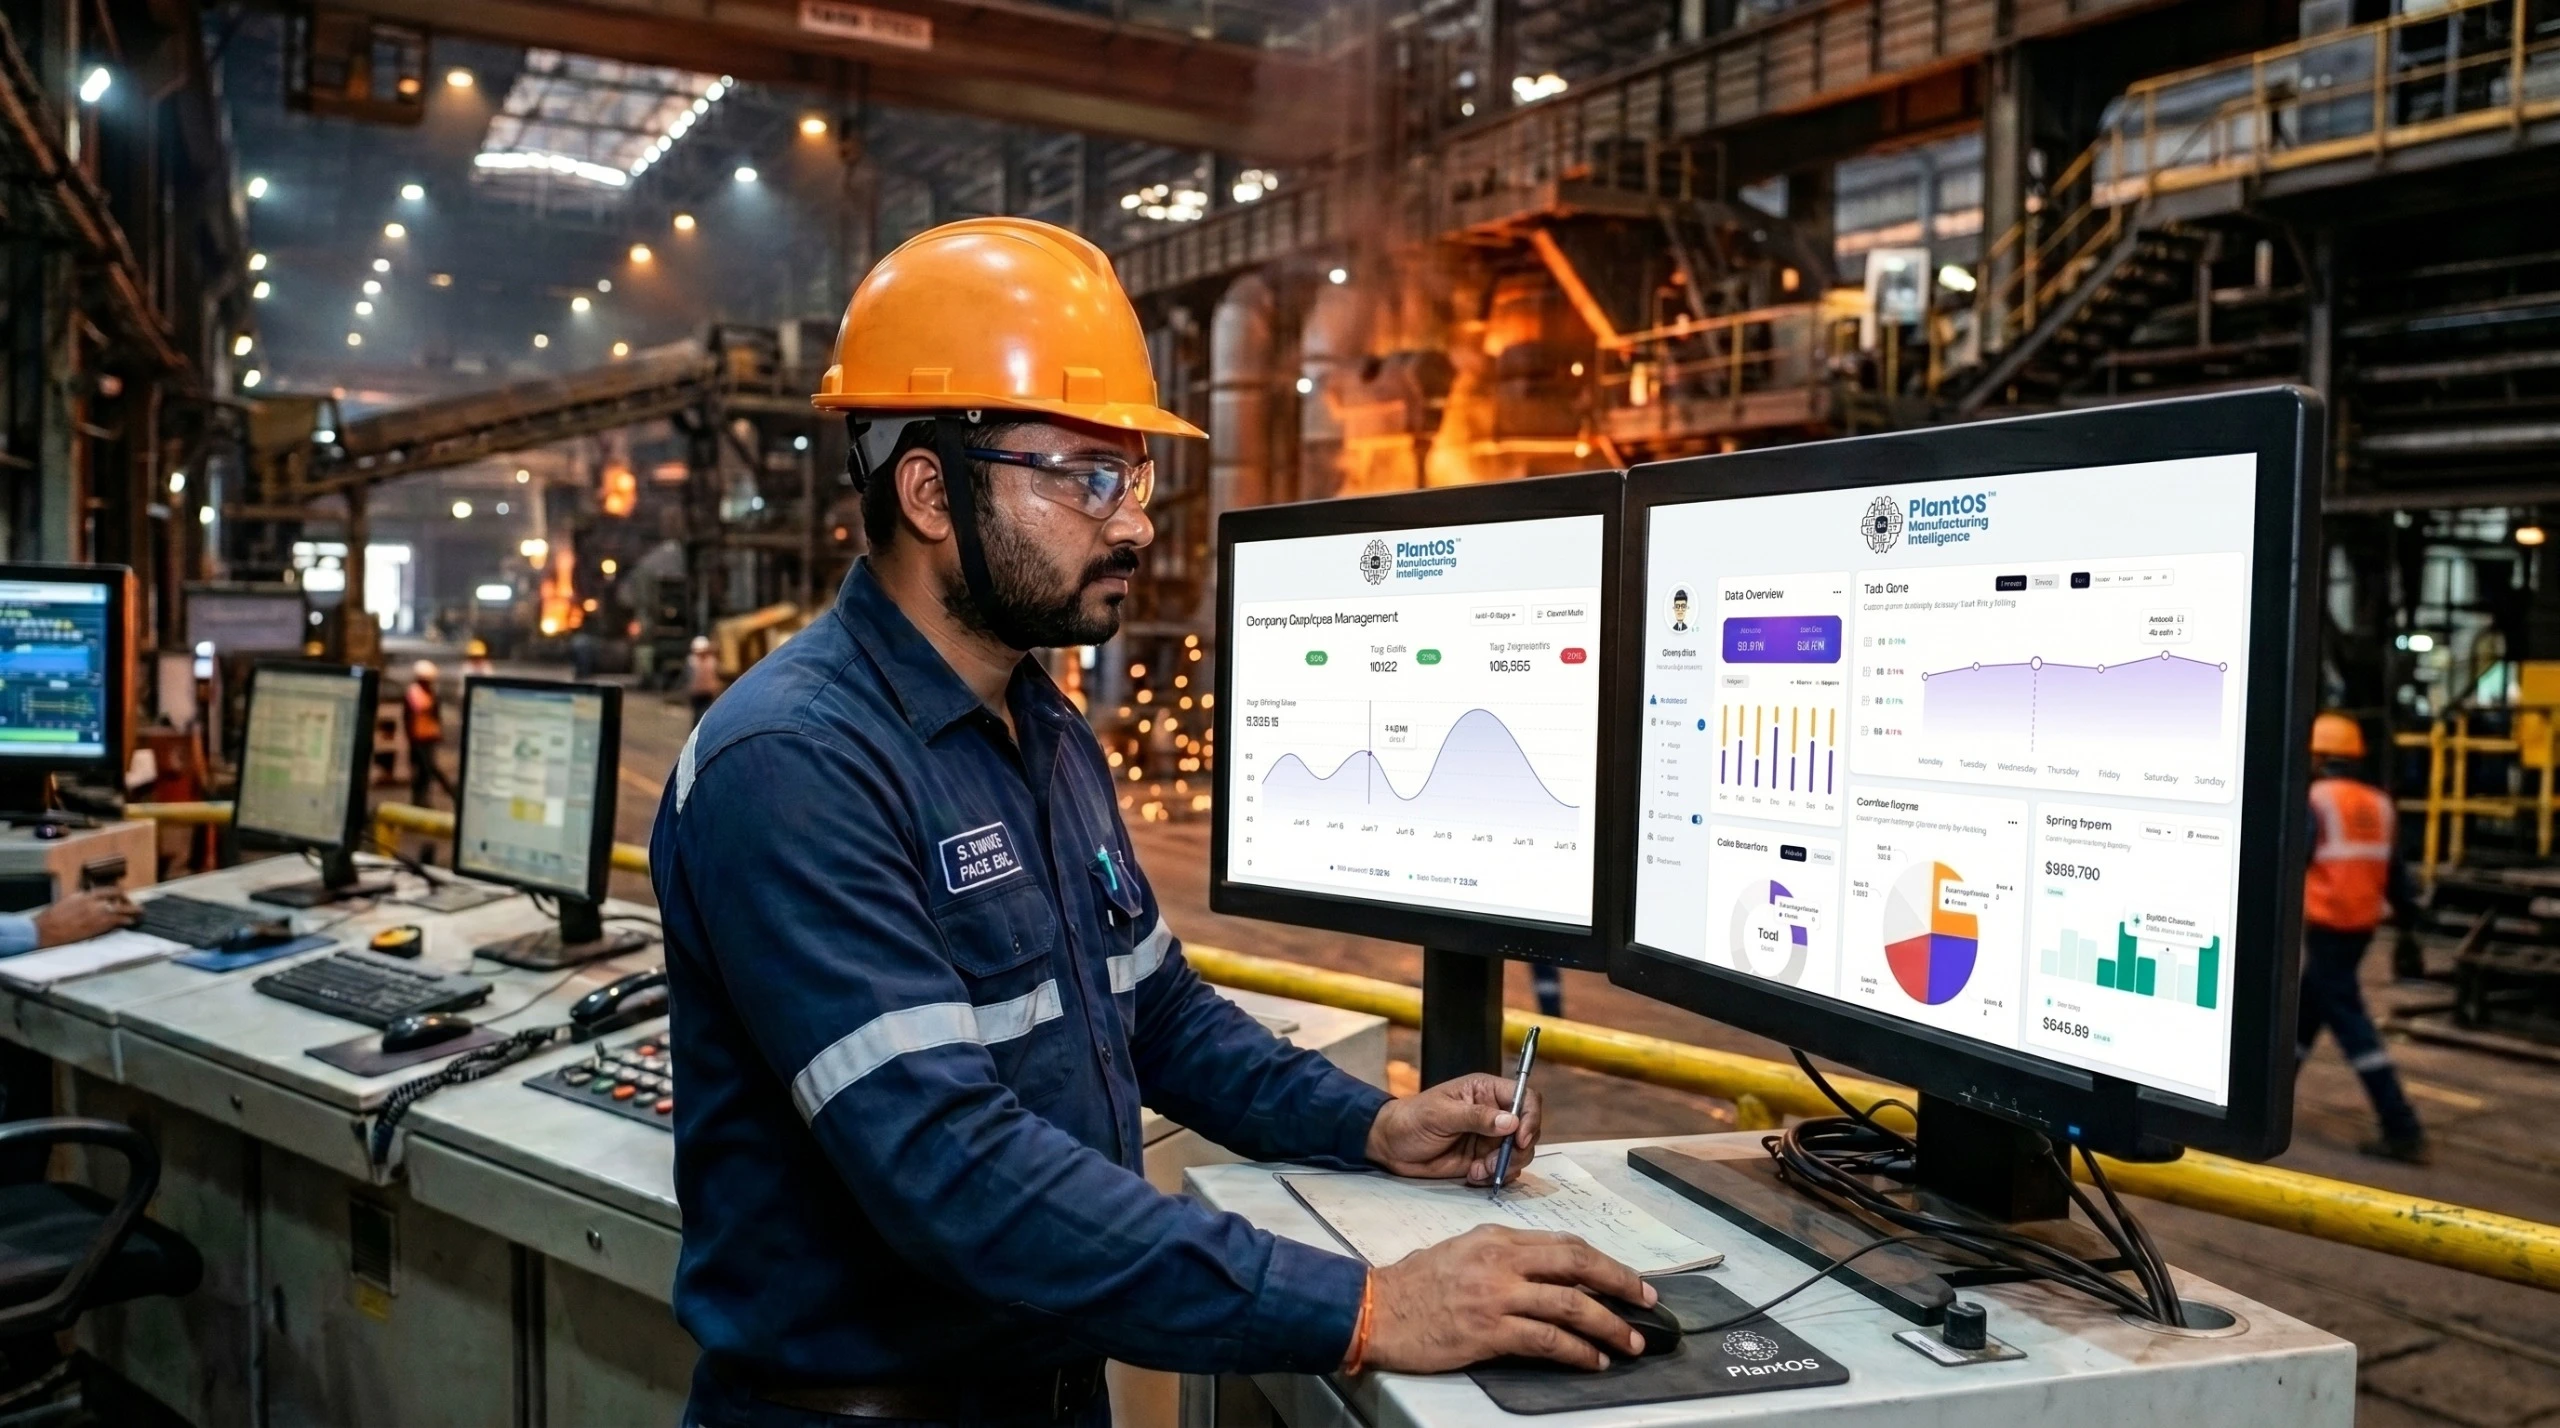
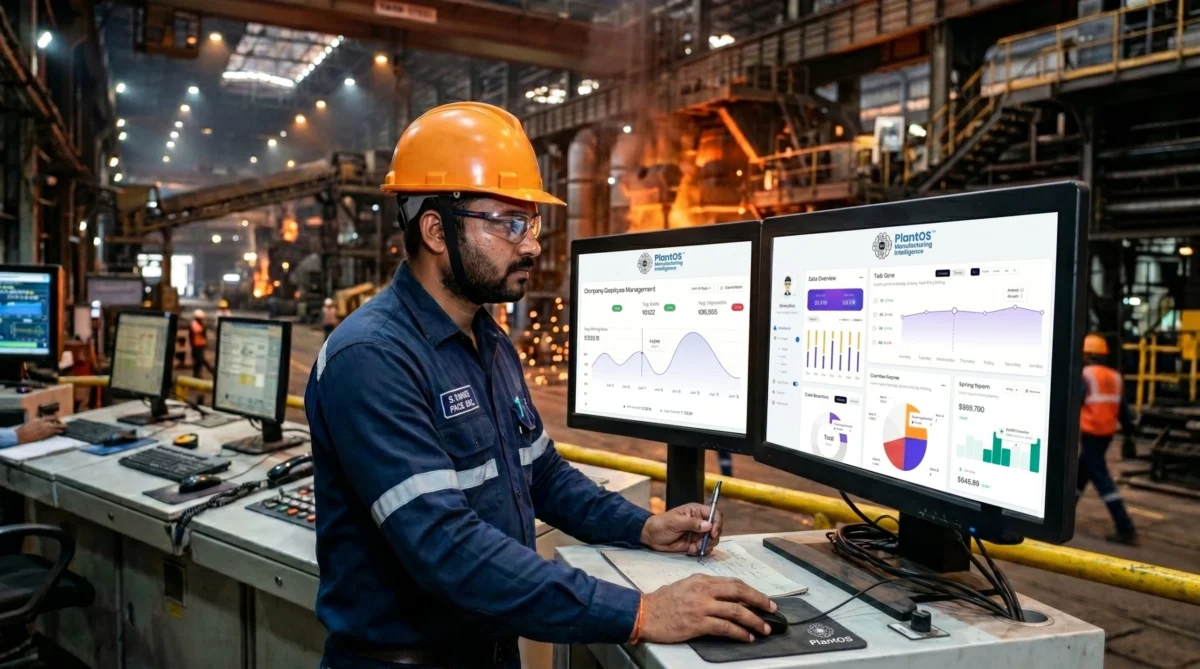
Steel plant operator in safety gear monitoring PlantOS™ manufacturing intelligence dashboard on dual screens inside an active steel mill, AI-powered condition monitoring and prescriptive maintenance in real-time plant operations.

Steel plants rarely fail loudly. They fail quietly. The tap happens on time. The cast continues. The rolls turn. And yet — energy consumption creeps up, emissions intensity worsens, refractory life collapses early, electrodes burn faster, operators compensate manually, and the cost is discovered weeks later on the power bill, fuel ledger, or sustainability report. This is the hidden reality of process-induced faults in steel manufacturing: faults born not out of breakdown, but out of operating drift. faults born not out of breakdown, but out of operating drift. Closing that gap requires prescriptive maintenance that goes beyond alarms — and condition monitoring that reads the signals conventional systems never correlate.

Blast Furnace

When furnace ‘stability’ quietly increases fuel rate

The fault that hides in plain sight

In blast furnace operation, uniform gas distribution through tuyeres is non-negotiable. Yet real furnaces rarely stay perfectly balanced. Small variations accumulate:
  • Coke degradation altering permeability
  • Uneven burden descent
  • Minor cooling-water deterioration at specific tuyeres
  • Drift in oxygen enrichment or PCI injection patterns
These factors cause localized raceway instability, increasing thermal and mechanical stress on specific tuyeres well before any alarm fires.
Studies and plant audits show that a 10–30 kg/thm increase in fuel rate often occurs without furnace instability. Cooling imbalance precedes burn through events by days to weeks. Operators compensate unknowingly by increasing blast or fuel input. The furnace keeps running — but at higher carbon and fuel cost.

10–30 kg/thm

Fuel rate increase — without any furnace instability alarm

$0.8–1.2 M

Production loss per tuyere burnout emergency

A single tuyere burnout can cost $0.8–1.2 million in production loss during emergency replacement, yet most failures are preceded by detectable thermal and flow anomalies that go uncorrelated in standard DCS monitoring.

How PlantOS™ intervenes

PlantOS™ monitors correlated patterns, not single tags:

• Spatial temperature deviations across tuyere cooling circuits
• Raceways behaving differently despite ‘normal’ absolute values
• Cooling delta and gas flow patterns that do not match expected furnace physics

Instead of waiting for a threshold breach, PlantOS™ flags emerging imbalance clusters, prescribes targeted operating corrections (air distribution review, charging pattern adjustment, tuyere inspection), and allows operators to intervene before fuel rate inflation hardens into cost.

Electric Arc Furnace (EAF)

Power losses that don’t trigger trips — but blow up costs

The fault no KPI captures

EAF dashboards often show: Normal tap-to-tap time. Acceptable yield. No trips. Yet hidden beneath this ‘good operation’ is one of the most expensive drifts in steelmaking: arc instability.
Arc instability is driven by:
  • Suboptimal electrode regulation
  • Poor foamy slag consistency
  • Scrap mix variability and uneven meltdown
  • Transformer tap and reactance mismatch
Research shows unstable arcs increase kWh per ton, accelerate electrode erosion — and remain invisible to standard prescriptive maintenance systems that monitor only mechanical vibration and temperature thresholds.

3-7%

Increase in kWh/t from arc instability

30 GWh/yr

Excess electricity in a 1 Mtpa EAF shop at 30 kWh/t drift

In 1 Mtpa EAF shop, even a 30 kWh/t drift equals 30 GWh of excess electricity per year, with no classical alarm to expose it.

How PlantOS™ intervenes

PlantOS™ correlates:

• Electrode movement behavior
• Current and voltage waveform variance
• Oxygen and carbon injection patterns

It identifies non-obvious instability signatures — situations where absolute values are acceptable, but relationships are wrong — then prescribes arc-length corrections, slag chemistry stabilization actions, and power program optimization phases. These corrections restore energy coupling without slowing the heat delivering measurable AI for outcomes your energy manager can report.

Reheating Furnaces

How safety margins turn into permanent fuel loss

The fault masked as a ‘safety margin’

Reheating furnaces in rolling mills are notorious energy consumers. The most common process-induced fault is not burner failure – it is temperature overshoot used to hedge uncertainty.
Root causes include: fuel calorific value fluctuation, poor synchronization between walking beam motion and firing zones, refractory degradation increasing wall losses, and manual setpoint buffers added to avoid underheating risk.
This leads to 10-15% higher fuel consumption, increased scale formation (5-6% billet oxidation loss), and uneven metallurgical properties downstream – all while slabs still discharge ‘on temperature’.

60–70%

Of a rolling mill’s total thermal load consumed by reheating furnaces

12–15%

Fuel reduction achievable with correlated combustion optimization

How PlantOS™ intervenes

PlantOS™ overlays:

• Zone-wise thermal profiles
• Walking beam kinematics
• Burner efficiency behavior
• Historical slab temperature trajectories

It detects systemic over-firing patterns - not momentary spikes - and recommends fine-grained combustion corrections that operators validate heat by heat. Plants using such correlation approaches routinely achieve 12–15% fuel reduction without risking rolling quality.

Rolling Mills

Throughput looks fine — energy intensity worsens

The fault no one alarms for

Rolling mills are assumed to be mechanically stable once commissioned. In reality:
  • Roll wear increases friction
  • Hydraulic imbalance raises resistance
  • Descaler inefficiency raises load
  • Misalignment causes motors to draw excess current

10–15%

Increase in energy per ton rolled from accumulated mechanical drift — with no effect on tonnage or schedule

KPIs stay green. Energy intensity silently worsens. This is exactly the blind spot that AI predictive maintenance and continuous asset monitoring are designed to close catching drift before it becomes cost.

How PlantOS™ intervenes

PlantOS™ correlates:

• Motor current vs rolling force
• Hydraulic pressures vs strip dimensions
• Descaling performance vs surface drag

Instead of generic ‘high load’ alerts, it surfaces force–energy mismatches, guiding maintenance and process teams to correct the true cause — not the symptom.

Utilities

Compressed air & fans — the permanent energy leak plant heads underestimate most

Utilities consume a substantial share of a steel plant’s total electricity. Compressed air leaks alone waste a significant proportion of generated air in poorly monitored systems. The challenge is not awareness — it is attribution. Which compressor? Which distribution leg? Which demand is artificial vs productive?

20–30%

Of a steel plant’s total electricity consumed by utilities

25–40%

Of generated compressed air wasted in poorly monitored systems

How PlantOS™ intervenes

PlantOS™ fingerprints:

• Compressor load patterns
• Pressure–flow relationships
• Usage behavior tied to production states

It exposes structural waste, not random leaks — allowing operators to attack the biggest energy drains first.

Why DCS Alarms and Energy Reports Miss What Actually Matters, Why Traditional Monitoring Fails — and PlantOS™ Succeeds

Steel plants already have data. What they lack is contextual intelligence. DCS alarms monitor thresholds. Energy reports aggregate results. Maintenance systems log failures. PlantOS™ works between them.


It detects anomalies early (before thresholds), Correlates across process + energy + equipment, Prescribes operator-validated actions, Builds a living memory of “what worked where”. This approach aligns with proven industrial AI research showing that self-supervised, plant-scale anomaly detection dramatically outperforms static alarms in steel environments.

The Gap That Remains — and Where It Lives 01

Steel plants are not data-poor. They are connection-poor. DCS platforms show what is happening in blast furnaces, EAFs, reheating furnaces, rolling mills, and utilities. Maintenance systems explain why assets eventually fail. Energy, power, and emissions reports show what already occurred — after the heat is tapped, the coil is rolled, and the bill is paid.
What none of these answer — in real time — is the question that now carries direct financial, carbon, and regulatory weight:

Which process deviation, interacting with which emerging asset condition, is inflating energy per ton of steel right now — and by how much?

This is the gap where energy cost, carbon exposure, and reporting risk accumulate quietly. It is where disclosure confidence weakens, incentive eligibility is lost, and corrective action becomes reactive instead of economic.

Closing this gap requires more than dashboards or alarms. It requires continuous correlation between process behavior, energy intensity, and asset health — followed by prescriptive actions that operators can validate and trust. This is precisely where Infinite Uptime’s Process Business, built on PlantOS™, operates. PlantOS™ identifies energy-relevant anomalies in steel operations while they are still recoverable:

  • Blast furnace gas-flow or tuyere imbalance before rising fuel rate hardens into sustained cost
  • EAF arc-stability degradation before kWh per ton increases compound across heats
  • Reheating furnace over-firing masked as safety margin while fuel efficiency can still be restored
  • Rolling-mill force–energy mismatches that never trip alarms because throughput never drops
Critically, the system does not act in isolation. Every recommendation is reviewed, validated, and owned by operators on the floor. This is not automation replacing judgment — it is agentic intelligence amplifying it. Over time, each validated intervention becomes part of a growing operational memory: what worked, under which operating conditions, on which assets — and with what measurable impact on energy, cost, and carbon per ton of steel

In the Field: What Operator-Validated Outcomes Look LikeID Fans02
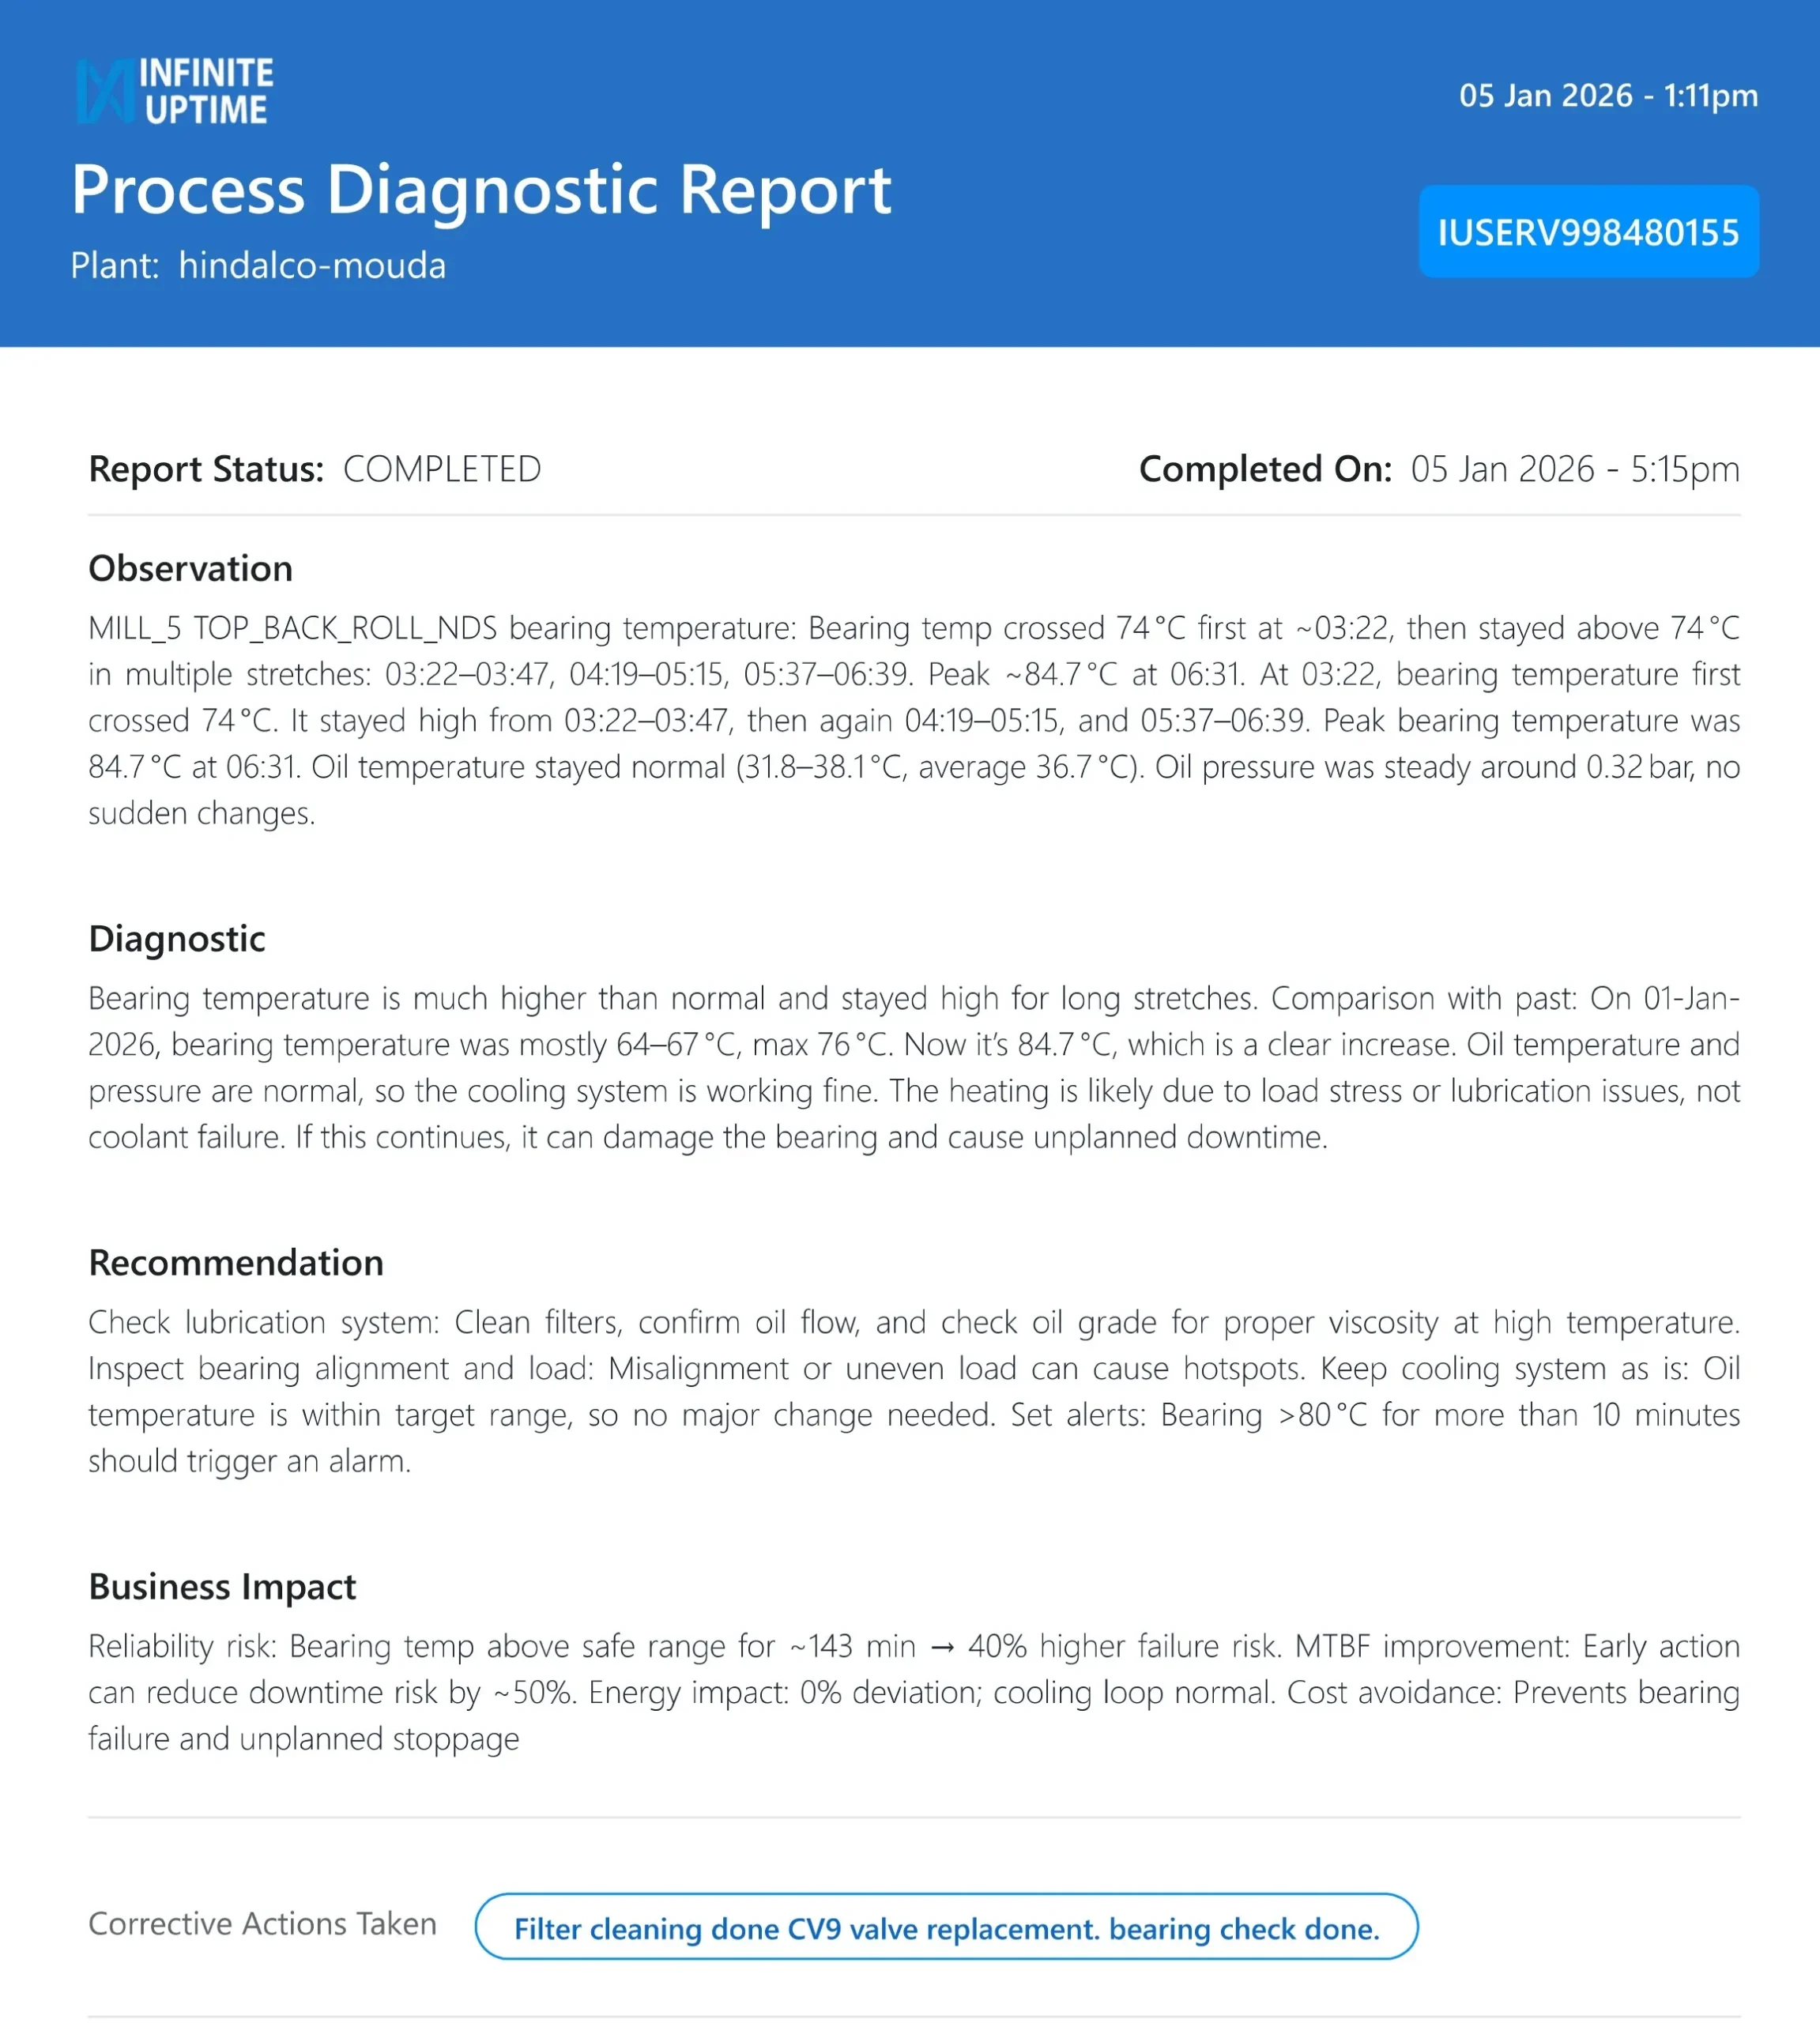
In an Aluminum Foil making company,
PlantOS™ Process Diagnostic Report for Hindalco Mouda plant showing bearing temperature anomaly observation, AI-generated diagnosis, prescriptive maintenance recommendation, and corrective actions taken - operator-validated industrial AI output.
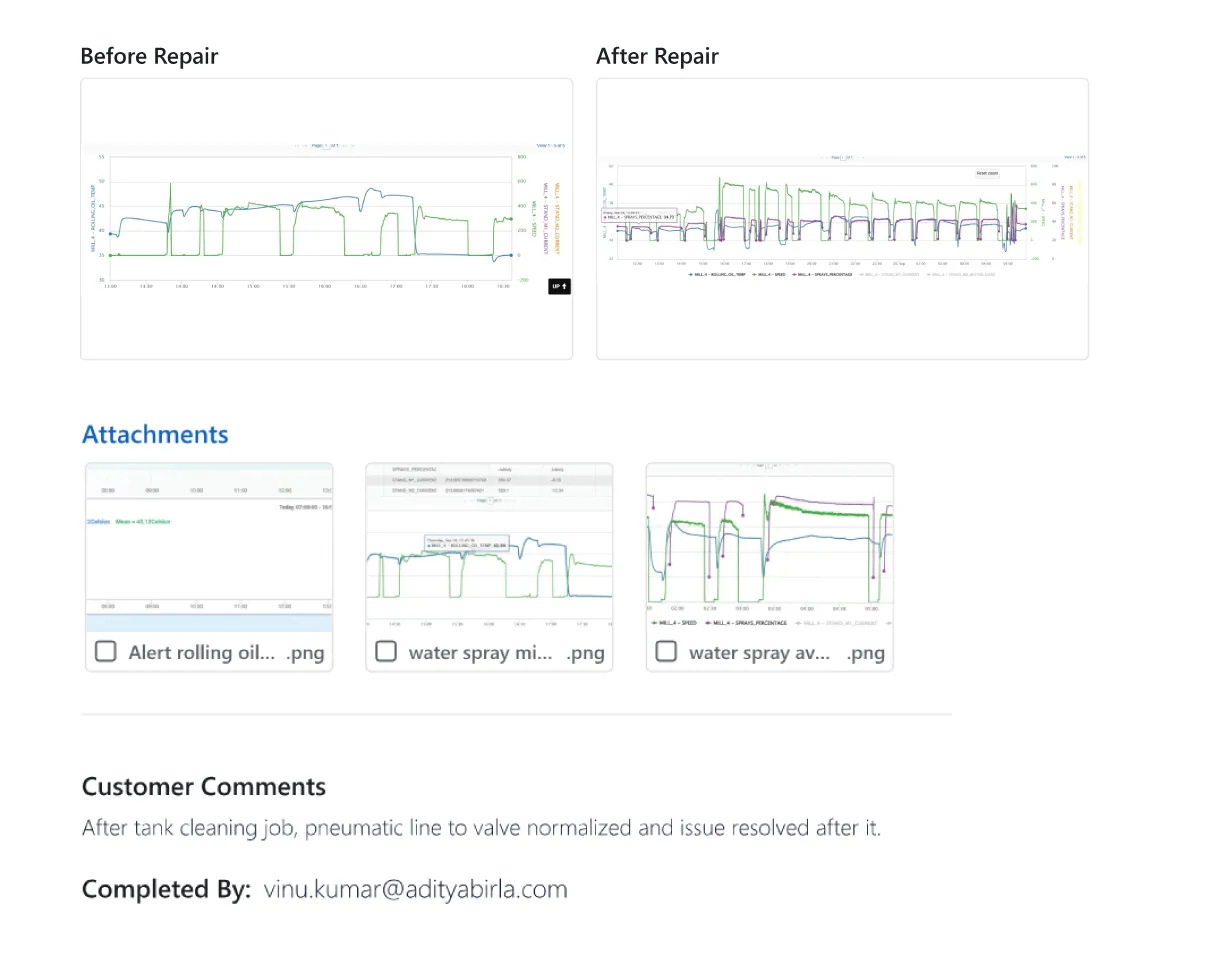
PlantOS™ condition monitoring dashboard showing rolling oil temperature anomaly on Mill-4 before and after repair, trend charts with spray percentage and mill speed correlations, operator-validated prescriptive maintenance outcome.
During rolling operations on Mill-4, the rolling oil temperature increased abnormally to approximately 55 °C, despite stable mill speed, load, and motor current. Comparative analysis showed the oil spray cooling system was inactive during rolling; comparison with similar runs confirmed spray non-operation as the root cause. Recommendation was precise: Enforce spray-cooling interlocks and alarms, validate spray controls, and set a minimum spray flow during rolling.

Clear Business Impact stated prevention of accelerated oil degradation, excess chiller energy use (~226 kWh/event), equipment thermal stress, and improves MTBF while avoiding repeat energy and maintenance costs.

This is not just a case study prepared for a presentation. This is Process Prescription Report generated by PlantOS™, acted & validated by plant operators, and time-stamped to the hour. The observation, diagnostic, recommendation, corrective action, and business impact are all in one record — auditable, explainable, and Reporting ready.
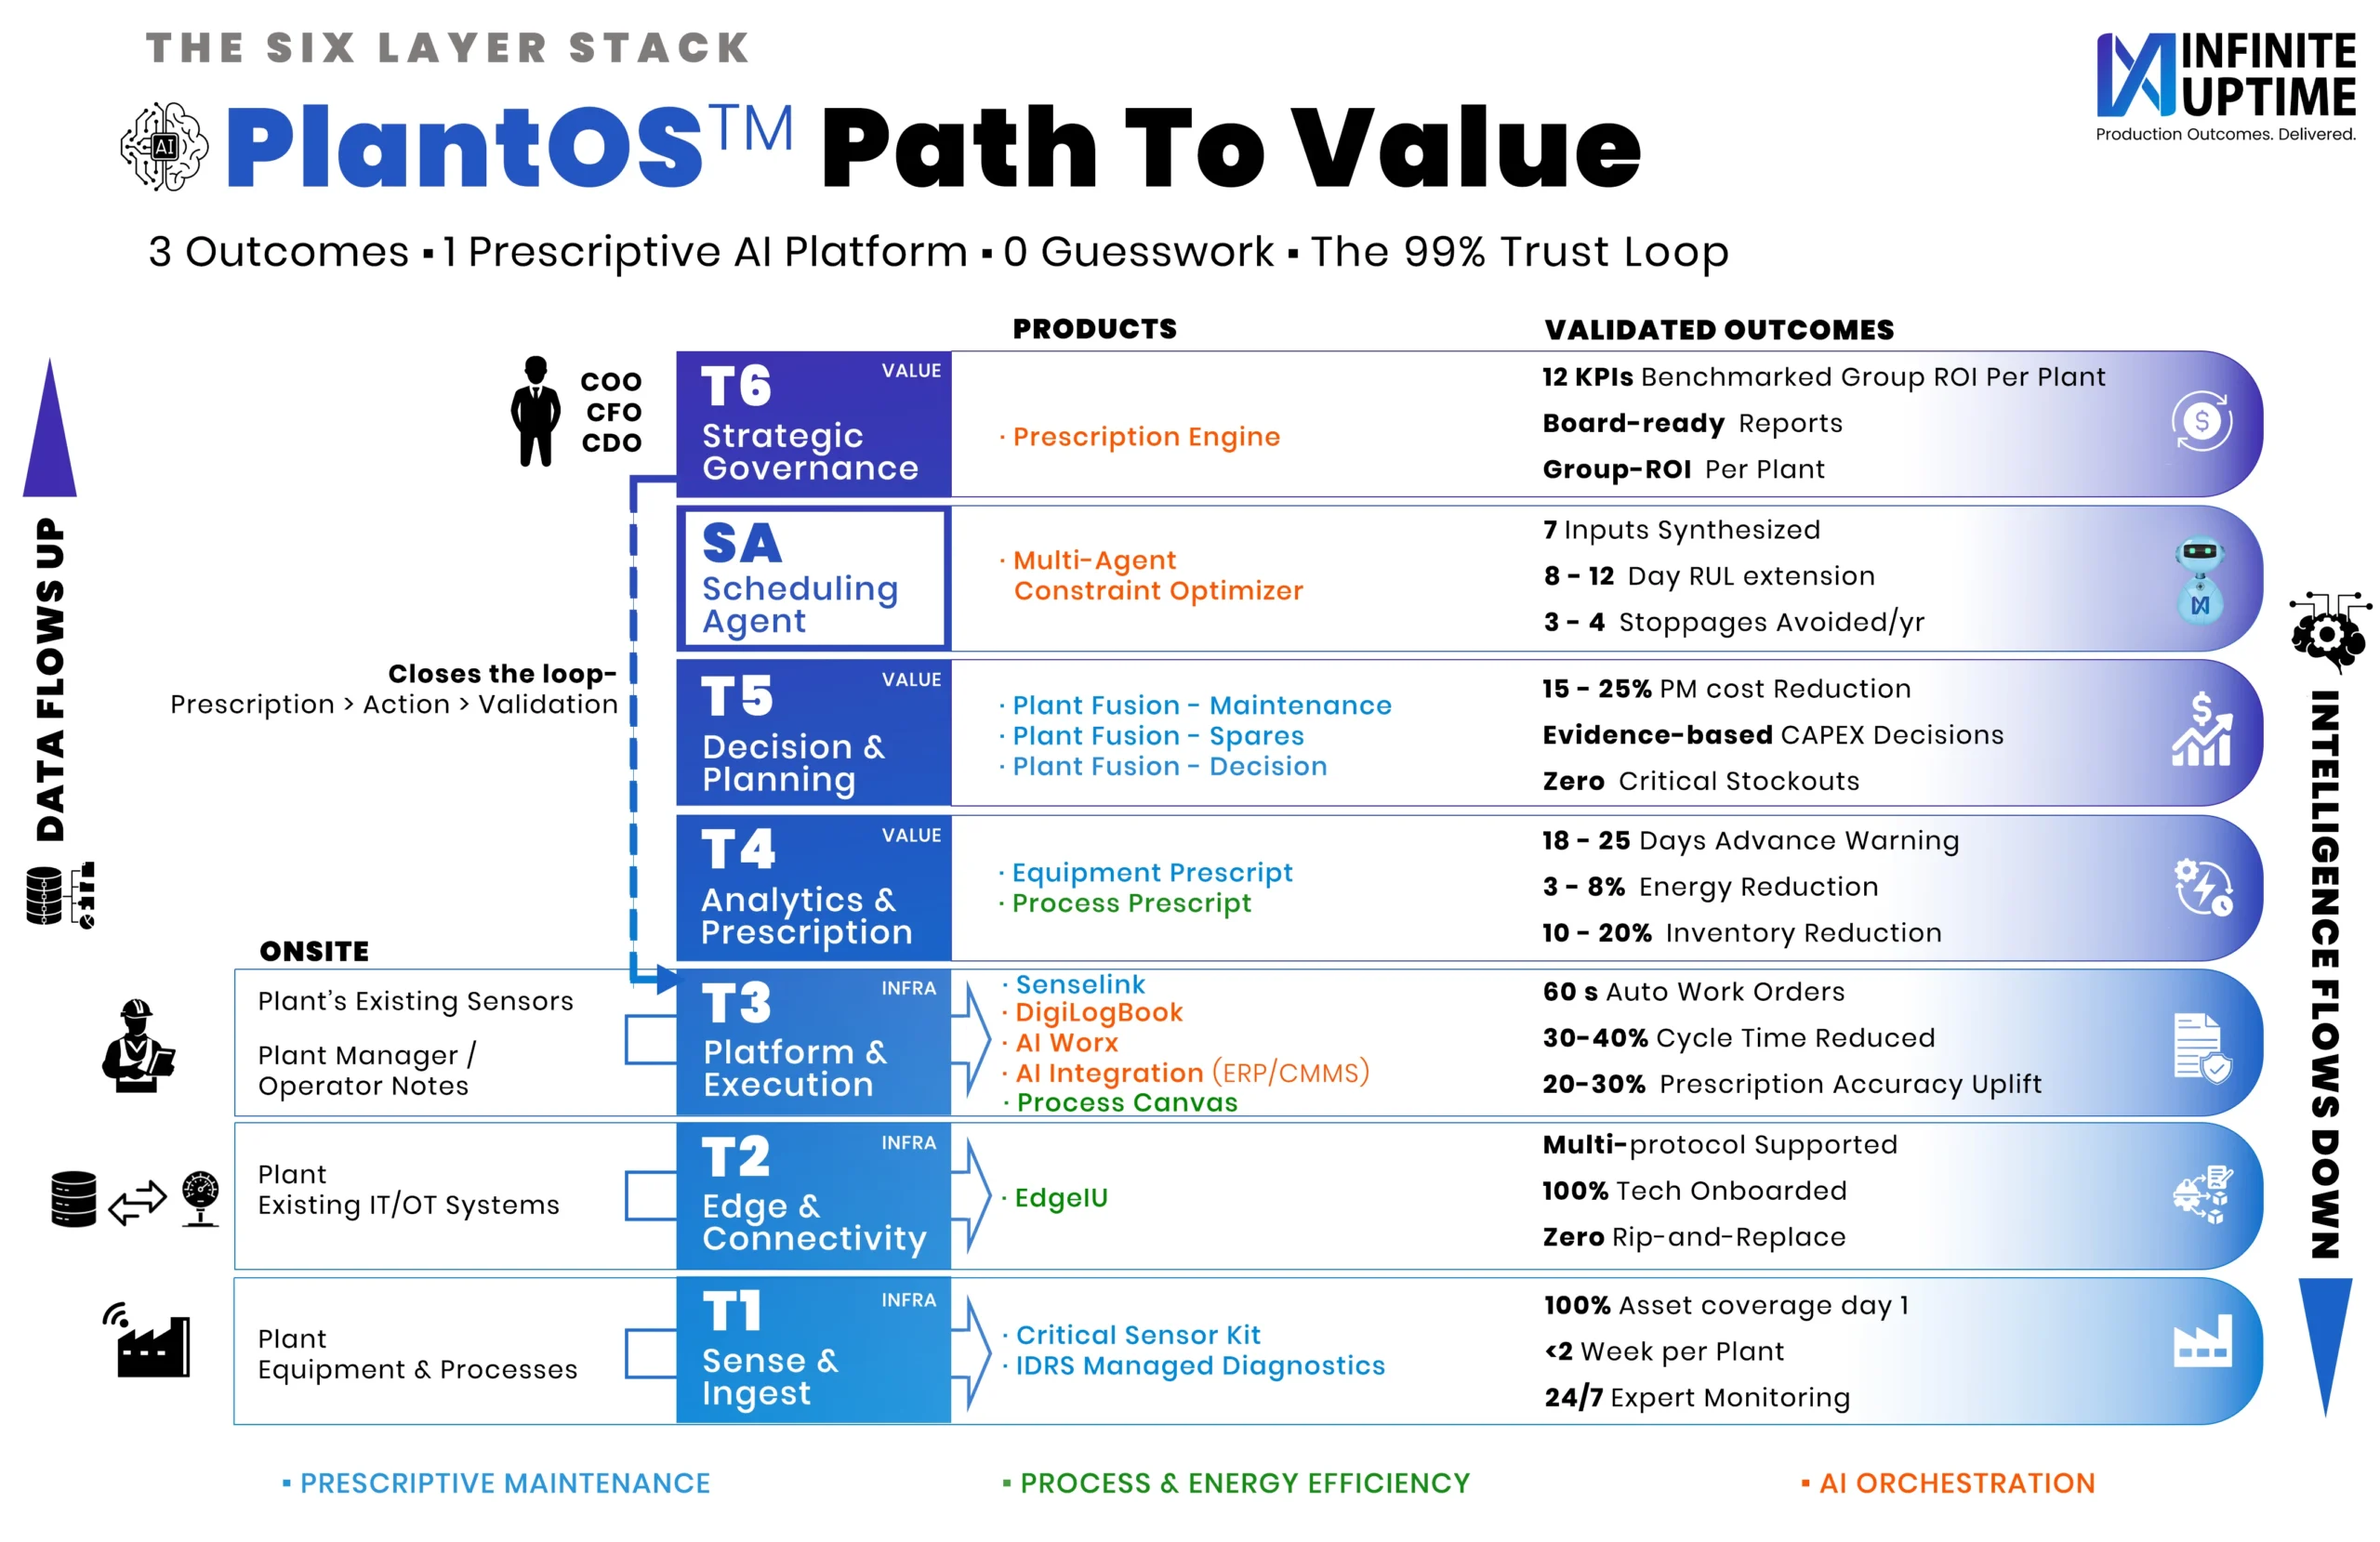
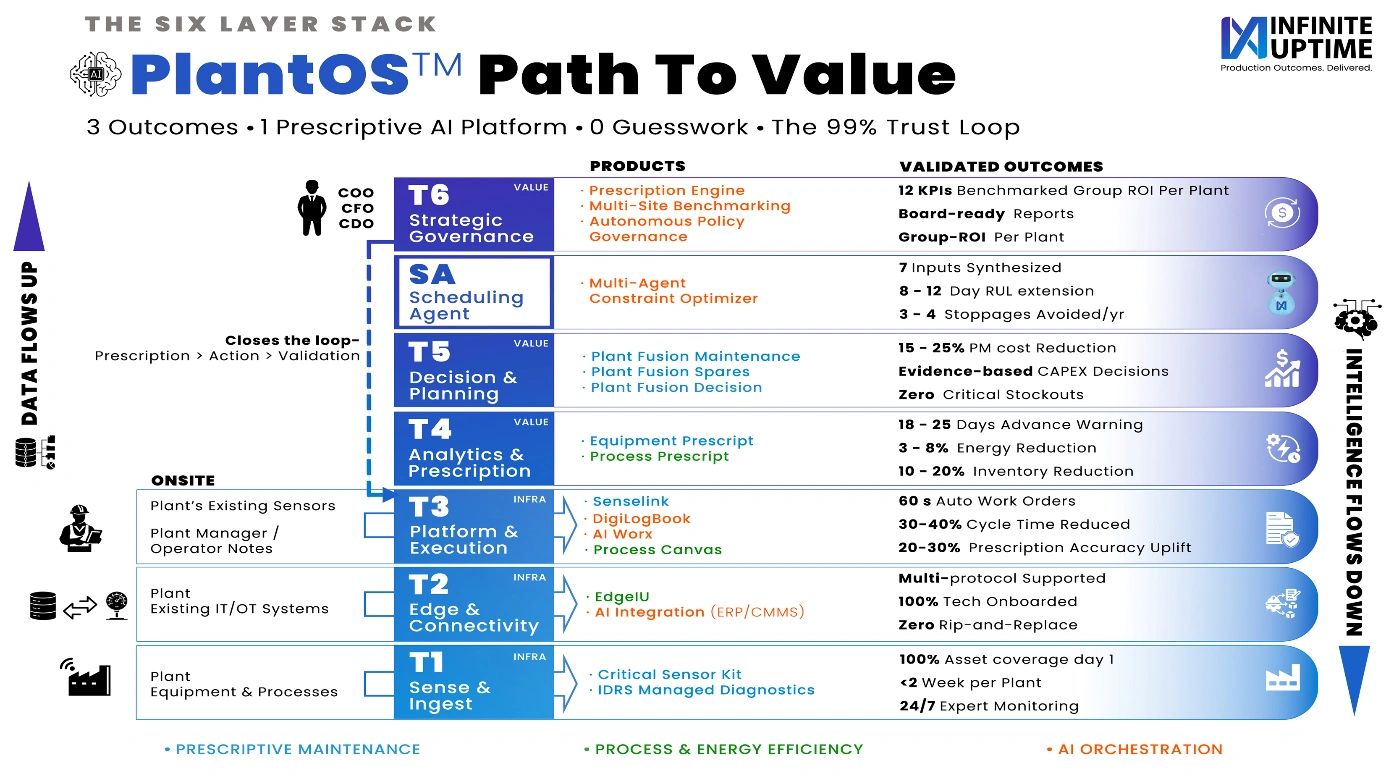
PlantOS™ six-layer prescriptive AI platform architecture showing T1 to T6 stack from sense and ingest to strategic governance, with validated outcomes including 3–8% energy reduction and 18–25 days advance warning for steel plant operations.

The architecture above shows how PlantOS™ moves from raw plant data at the equipment and process layer (T1) through edge connectivity, platform execution, and prescriptive analytics (T2–T4), to decision planning, AI orchestration, and strategic governance (T5–T6). For cement energy management, the critical path runs through Process Canvas at T3 — which makes energy drift visible and explainable — and Process Prescript at T4, which converts correlated anomalies into timed operator actions. The 3–8% energy reduction validated at T4 is not a modelled estimate. It is an outcome confirmed by operators who acted on prescriptions, closed the loop, and logged the result.

This is what positions PlantOS™ as Industrial Agentic AI for Operator-Validated Outcomes — not a monitoring layer, but a decision layer that closes the loop between data, human judgment, and measurable impact.

Process-induced faults inflate energy, carbon, and cost while production looks stable. Infinite Uptime’s PlantOS™ closes that blind spot – not by replacing operators, but by giving them actionable, trusted insight exactly where conventional systems go silent. That is how energy is saved. That is how carbon is controlled.

If you only see problems after the monthly report, you’re already paying for them!

From Predictive Maintenance to Prescriptive Maintenance: What the Difference Means on the Plant Floor

Predictive maintenance tells you a bearing will fail in 14 days. Prescriptive maintenance tells you exactly which bearing, which lubrication procedure, and which shift to do it in — before the failure window opens. The gap between these two is where millions are lost in steel plants. AI predictive maintenance systems flag the risk. Prescriptive AI closes it. PlantOS is built on the second — continuous condition monitoring and asset monitoring that generates operator-validated actions, not just alerts. That is AI for outcomes.

Infinite Uptime’s PlantOS™ helps Steel manufacturing plants identify and correct energy-relevant process anomalies in real time — before they become carbon costs. To explore what this looks like for your operations

Get in touch here →
Frequently Asked Questions

Process-induced faults are deviations caused by operating conditions (load, control settings, system interactions) rather than mechanical failure. These faults often do not trigger alarms but lead to higher energy use, instability, and hidden cost losses.

DCS systems monitor individual thresholds (temperature, vibration, pressure).
They do not:
  • Correlate data across systems
  • Detect subtle deviations before limits are breached
  • Identify relationships between process, energy, and asset health
  • Predictive maintenance: Tells you what might fail and when
  • Prescriptive maintenance: Tells you:
    • What exactly to fix
    • Why it is happening
    • What action to take
    • When to act
PlantOS™ focuses on closing the loop from detection to action.
PlantOS™ uses correlated, multi-variable analysis, looking at:
  • Process behavior
  • Energy consumption
  • Equipment signals
Instead of isolated alerts, it identifies patterns and relationships that indicate early-stage deviations.
These impacts are often invisible until reporting stage.
PlantOS™ doesn’t directly generate reports, but it provides:
  • Granular, asset-level energy data
  • Traceable operational records
This data supports more accurate and defensible emissions calculations.
Energy efficiency is not a standalone feature.
It is an outcome of better operational decisions, including:
  • Optimized process control
  • Reduced drift
  • Corrected inefficiencies
Traditional systems:
  • Detect failures
  • Trigger alarms
PlantOS™:
  • Detects early deviations
  • Explains root cause
  • Prescribes exact actions
  • Tracks outcomes

References:

  • The Operation of Contemporary Blast Furnaces | Springer Nature Link
  • Causes and treatment measures for abnormal blast furnace conditions
  • Blast Furnace Tuyere Maintenance: Inspection, Replacement & Failure Prevention Guide
  • Arc Stability and Power Input in the EAF | LinkedIn
  • Energy Loss Analysis in Steel Manufacturing
  • Reheat Furnace Analytics: Burner, Refractory & Walking Beam System Guide
  • Reduce Consumption of Rolling Mill Reheating Furnace
  • ijaerv12n23_48.pdf
  • Improving Compressed Air System Performance: A Sourcebook for Industry
  • Handsfree, Fully Autonomous Anomaly Detection AI
Categories
AI Predictive Maintenance Energy Efficiency
Prescriptive AI for U.S. Cement

Prescriptive AI for U.S. Cement Closing the Margin and Sustainability Gap Predictions Miss

Why prescriptive AI — not predictive AI — is the lever U.S. cement plants are missing. How PlantOS turns silent process drift into operator-validated outcomes that simultaneously improve margin, emissions intensity, and audit-ready compliance under U.S. sustainability frameworks.

Read Time: 8–9 minutes | Author – Kalyan Meduri

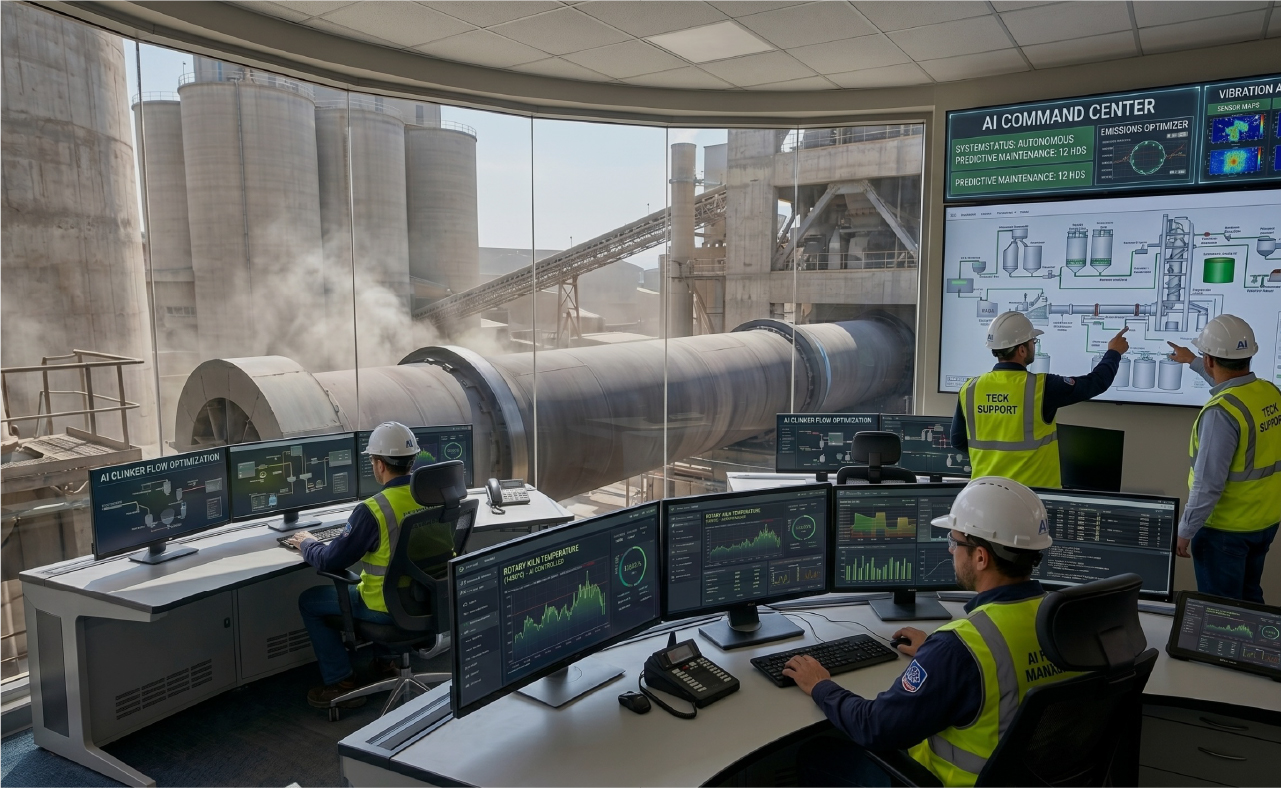
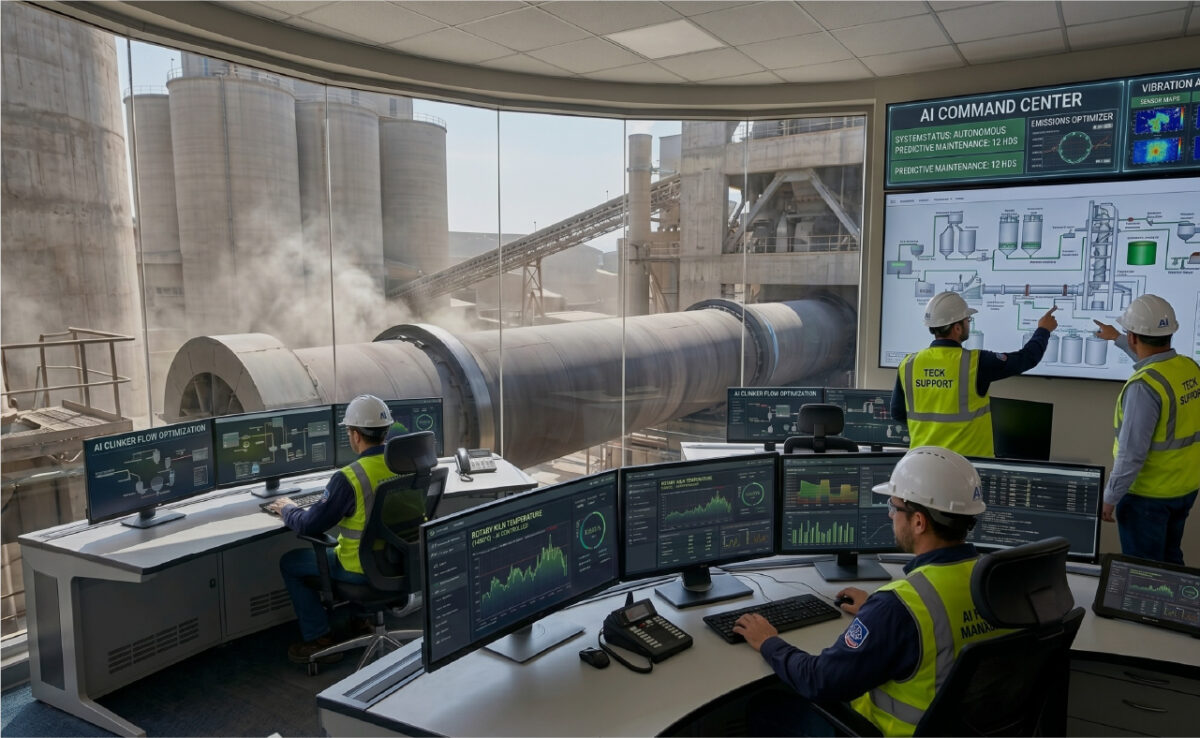
Cement plant control room with prescriptive AI analytics monitoring rotary kiln operations and emissions

The U.S. cement industry has spent the better part of a decade investing in industrial AI. DCS platforms
are connected. Maintenance systems are digitized. Predictive models flag emerging faults. And yet, on
most plants we walk into, three to eight percent of the energy bill is being spent on inefficiency that no
system has surfaced — quiet process drift hiding in plain view of every monitoring tool the plant owns.


What is new: this same drift now directly affects more than margin. It inflates reported Scope 1 and
Scope 2 emissions intensity, weakens Environmental Product Declarations (EPDs), and creates disclosure
risk across Buy Clean programs and California’s climate reporting regime.

This is the gap between predictive AI and prescriptive AI — and it has become the single most expensive
blind spot in U.S. cement operations.


Predictive AI tells a plant what is likely to happen. Prescriptive AI — AI for outcomes — tells the operator
what to do about it, with a specific, validated, time-stamped action calibrated to the asset and the
process. The first is a forecast. The second is a decision. The first generates alerts. The second generates
results.


Prediction ≠ Outcomes.


For U.S. cement producers operating in 2026 — under California’s August disclosure deadline,
hyperscaler procurement pressure on embodied carbon, EU CBAM exposure on exports, and the simple
fact that energy is the largest controllable cost in cement after raw materials — the difference between
prediction and prescription is no longer academic. It is the difference between knowing about a problem
and closing it.

It now determines whether a plant’s sustainability data is defensible — or just estimated.

The Outcome Gap

Where Cement Plants Are Connection-Poor, Not Data-Poor01

Most U.S. cement plants are not data-poor. They are connection-poor. DCS platforms show what is happening. Maintenance systems explain why assets fail. Energy and emissions reports show what already occurred. Predictive AI overlays add a fourth signal: what may happen next.
What none of these answer — in real time — is the question that now carries both financial and sustainability weight:

Which process deviation, interacting with which emerging asset condition, is inflating energy intensity right now — and what should the operator do about it in the next two hours?

This question matters not only to cost control, but to:

  • Energy intensity metrics feeding Scope 1 and Scope 2 disclosure
  • Plant-level EPD accuracy for Buy Clean tenders
  • Assurance defensibility under California SB 253
  • Carbon benchmarks applied under EU CBAM default values

These are prescriptive questions. Dashboards cannot answer them. Alerts cannot close them. Only prescriptive AI that links process behavior → energy intensity → operator action can.

This is the work prescriptive AI for outcomes is built to do.

Predictive AI vs. Prescriptive AI in Cement Operations02

Reliability Condition Net Zero Impact Mechanism
Stable kilns Optimal fuel consumption, lower specific energy Consistent thermal profile reduces excess fuel burn
Reduced unplanned breakdowns Lower waste, reduced reprocessing, fewer emission spikes Eliminates energy-intensive restart cycles
Consistent operations Predictable emissions, reliable ESG reporting Steady-state process enables accurate carbon accounting
Higher uptime → higher throughput Amortises fixed-cost decarbonisation investments across more tonnes Spreads CAPEX of green upgrades over greater output volume

The Energy Arithmetic

Where Process Drift Quietly Inflates Cost01

Any process deviation that raises GJ per tonne of clinker or kWh per tonne of cement increases cost — and mechanically increases emissions intensity under U.S. and international accounting methodologies, regardless of fuel mix or offset strategy.

A plant may be compliant, permitted, and operating steadily — and still deteriorating against Buy Clean thresholds, customer EPD benchmarks, and insurer or lender intensity screens.

$500K–$700K

Annual thermal-only margin leak from a 0.1 GJ/tonne kiln drift on a one-million-tonne-per-year line, at typical U.S. solid-fuel costs. Including embodied-carbon exposure in tender outcomes and California disclosure, fully-loaded impact can multiply two to four times.

Process drift does not announce itself. It does not trigger downtime, alarms, or permit exceedances. It accumulates across four asset families that prescriptive AI has to address simultaneously.

Kilns and Calciners — Burning Fuel Without a Warning

Kiln instability remains the least visible source of thermal energy waste in U.S. cement plants. False air ingress, cyclone pressure imbalance, alternative fuel calorific variability, and swings in raw meal chemistry can push specific heat consumption well above benchmark. A kiln drifting from ~680 kcal/kg of clinker toward 750 kcal/kg represents roughly 10% higher fuel consumption — without triggering a single alarm. By the time monthly reports are reviewed, the burn is already in the books.

Vertical Roller Mills — Sensitivity at Scale

A stable VRM circuit consumes 20–23 kWh per tonne of cement. Under subtle instability — grinding bed oscillation, separator inefficiency, excessive circulating load — consumption climbs to 25–30 kWh per tonne. For a one-million-tonne-per-year mill, a sustained 3 kWh/tonne drift equates to 3 GWh of excess electricity annually. The process does not stop. Output appears normal. The inefficiency surfaces only in hindsight — exactly the kind of drift predictive AI underweights and prescriptive AI is built to catch.

Ball Mills — The Most Misleading Energy Risk

Ball mills present a particularly dangerous blind spot in legacy U.S. plants. Their inefficiency is structurally concealed by design. Suboptimal media charge, incorrect separator settings, high recirculation ratios, liner wear leading to slip rather than impact breakage, and pinion-girth gear misalignment can collectively raise power consumption 15–20% above optimal — often with no measurable loss in throughput. Specific energy consumption that should sit in the 35–42 kWh per tonne range quietly drifts higher. KPIs remain nominal. Availability remains high. The cost accumulates unnoticed.

Fans — Silent Multipliers

Fans account for 20–30% of total plant electrical load. Fouling, duct buildup, damper misalignment, or mechanical imbalance can increase fan power draw 10–15% without affecting production stability. These losses rarely show up in day-to-day operational discussions. They appear later in energy intensity metrics — long after the opportunity to intervene cheaply has passed.

The 2026 Pressure Map

Why Margin Pressure Now Comes from Three Directions 01

The federal climate apparatus that producers were preparing for in 2023 has been substantially rolled back. The SEC’s climate disclosure rules are no longer being defended. EPA’s Social Cost of Carbon is being phased out of regulatory analysis. IRA-era cement and concrete decarbonization grants have been canceled or terminated. For producers who built compliance plans around those frameworks, acute federal pressure has eased.

What has not eased — and is in many ways tightening — is pressure from three other directions:

01. Customers.

Data center hyperscalers, federal GSA buyers, and state-level Buy Clean programs in California, New York, New Jersey, Colorado, Maryland, Oregon, Washington, and Minnesota are placing active price-signal weight on low-embodied-carbon concrete. Plants that can document operator-validated energy intensity win these tenders. Plants that cannot, don’t.

02. California is now the de facto national disclosure regulator.

SB 253 requires U.S. companies above $1B in revenue doing business in California to disclose Scope 1 and Scope 2 emissions, with the first reporting deadline of August 10, 2026. CARB has signalled enforcement discretion for the first reporting cycle, but the disclosure obligation is binding. CARB has explicitly named cement production as a priority sector for Scope 3 phase-in in 2027. The state’s standing mandate to cut cement emissions 40% by 2035 (relative to 2019) and reach net-zero by 2045 is the binding long-term target for any producer with California exposure.

03. Trade and capital markets are pricing carbon even where Washington is not.

The EU’s Carbon Border Adjustment Mechanism applies default emission values starting in 2026, raising landed cost for U.S. clinker and cement exporters that cannot supply verified intensity data. Insurers and lenders increasingly price emissions intensity into capacity, rate, and ESG covenants.

None of these requires a federal carbon price to translate into real dollars. They already show up — in tender win rates, in insurance premiums, in lender covenants, and in the narrowing list of acceptable suppliers for the largest construction buyers in North America.

A plant operating with poorer energy efficiency carries a structurally higher emissions intensity — regardless of fuel mix or geography — and faces higher friction at every one of these touchpoints.

The Decision Layer

Sustainability as an Output, Not a Report01

Every PlantOS prescription produces:

  • A time-stamped operational action
  • A measurable energy outcome
  • A verified reduction in emissions intensity
  • An auditable record tied to real process behavior

This is exactly the level of evidence U.S. producers increasingly need for SB 253 disclosure readiness, EPD verification, Buy Clean compliance, and lender assurance — not estimates, not averages, but operator-validated outcomes.

Prescriptive AI therefore becomes a sustainability control system, not a reporting add-on.

How the Loop Closes

Closing the gap between data and outcome requires more than monitoring. It requires continuous correlation between process behavior, energy intensity, and asset health — followed by prescriptive actions that operators can validate and trust.

This is precisely where Infinite Uptime’s Process business, built on PlantOS, operates.

PlantOS identifies energy-relevant process anomalies while they are still recoverable: VRM separator drift before it hardens into systemic inefficiency, kiln heat imbalance while fuel efficiency can still be restored, chronic ball mill over-consumption that never trips an alarm because throughput never drops. Two PlantOS capabilities form the critical path:

Process Canvas makes energy drift visible and explainable across kiln, mill, and fan systems in a single correlated view.

Process Prescript converts correlated anomalies into timed operator actions — auditable, executable, and tied to a measurable outcome.

Every recommendation is reviewed, validated, and owned by operators on the floor. This is not automation replacing judgment. It is agentic AI amplifying it. Each validated action becomes part of the 99% Trust Loop — a growing operational memory of what worked, under what conditions, on which assets.

The 3–8% energy reduction validated across deployed plants is not a modeled estimate. It is an outcome confirmed by operators who acted on prescriptions, closed the loop, and logged the result.

This is what positions PlantOS as Industrial Agentic AI for operator-validated outcomes — not a monitoring layer, but a decision layer.

The Field Record

What Operator-Validated Outcomes Look Like 01

PlantOS is deployed across one of the largest cement and steel reference footprints globally — 844+ plants across 26 countries, 149 enterprises, and 9 verticals. Within that footprint, JSW Steel alone has eliminated 30,096 hours of downtime through 8,610 AI-assisted work orders, with 93% prescription adoption. Star Cement operates at 99% prescription adoption, with 10x ROI under six months.

The outcome below is representative of how prescriptive AI for outcomes actually appears in a Process Prescription Report:

Field Outcome  ·  Star Cement, SCL Line 2

Coal Extraction Fault — Kiln Firing System Trip

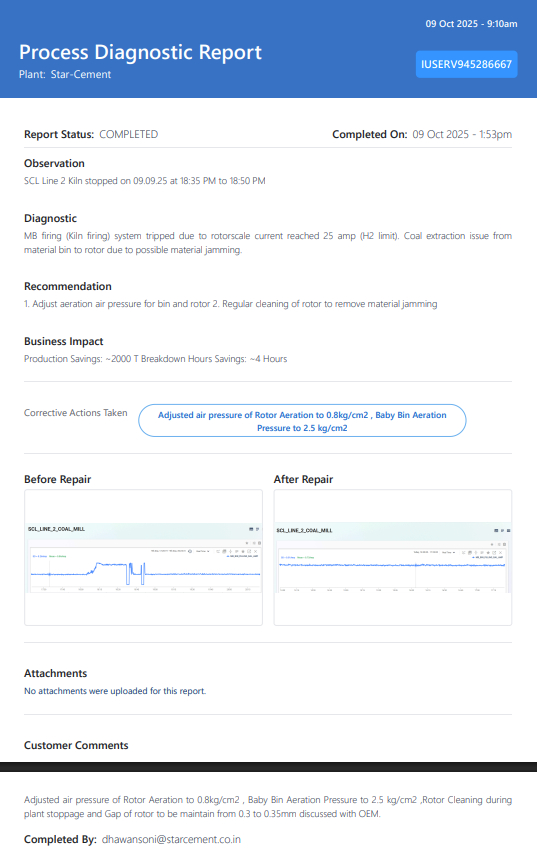
On 9 September at 18:35, the kiln stopped. PlantOS diagnosed the cause within the same operational window: the MB firing system had tripped because rotor scale current reached 25 amps — the H2 limit — due to material jamming in the coal extraction path from bin to rotor.

The prescription was specific: adjust aeration air pressure for bin and rotor; implement regular rotor cleaning to prevent recurrence. The operator validated and executed. Rotor aeration adjusted to 0.8 kg/cm². Baby bin aeration set to 2.5 kg/cm². Rotor gap confirmed at 0.3–0.35 mm in discussion with the OEM.

Customer comment, logged: "Corrective action found effective."

Approximately 2,000 tonnes of production protected. Four breakdown hours saved.

This is not a case study prepared for a presentation. It is a Process Prescription Report generated by PlantOS, acted on and validated by plant operators, time-stamped to the hour. The observation, diagnostic, recommendation, corrective action, and business impact sit in one auditable record — explainable, traceable, and ready for whatever assurance regime a producer needs to satisfy. This is the type of primary operational evidence increasingly required in:

  • California climate disclosures
  • Low-carbon procurement qualification
  • Third-party EPD verification
  • ESG audits tied to financing

The Operating Reality

Process Control Is Margin Control 01

In the U.S. operating environment, process control is margin control. It is also sustainability control — and, increasingly, the foundation of customer access, disclosure defensibility, and competitive position.

The plants that close this gap early — by moving from predictive AI to prescriptive AI for outcomes — will operate with lower unit cost, stronger tender economics, and a more defensible carbon footprint for the customers who are now actually pricing it.

The plants that do not will continue to discover the penalty — financial and reputational — only after it has already been paid.

See it on your plant

Find the 3–8% energy — and emissions intensity — your DCS isn't surfacing.

Infinite Uptime's PlantOS helps U.S. cement producers identify and correct energy-relevant process anomalies in real time — before they become margin, customer, or compliance costs.

Request a Plant Walkthrough  →
Categories
AI Predictive Maintenance Energy Efficiency
Process Anomalies to Carbon Penalties: The Hidden Energy Story Inside European Cement Plants

Process Anomalies to Carbon Penalties: The Hidden Energy Story Inside European Cement Plants How silent process drift inside cement plants became a priced carbon risk — and why the answer lies in the gap between what plants measure and what they miss.

Read Time: 5–6 minutes | Author – Kalyan Meduri

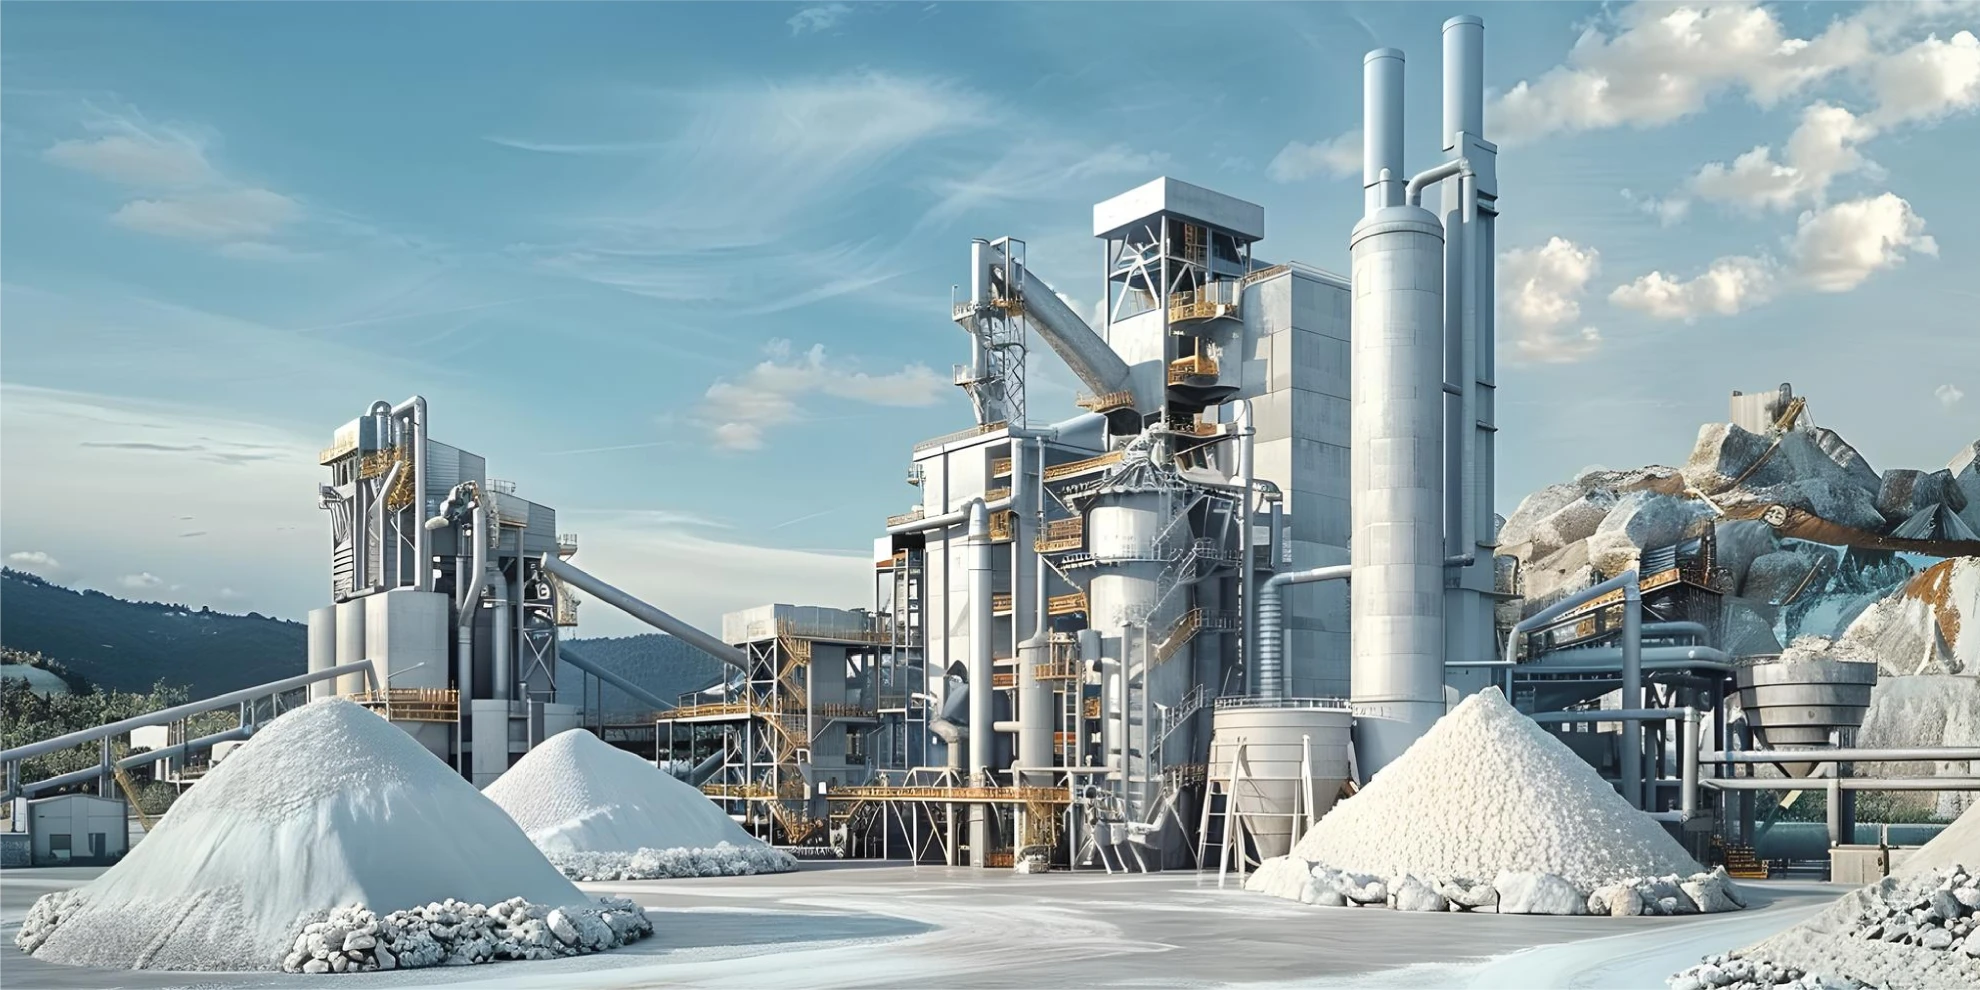
European cement plant with PlantOS industrial energy optimization reducing hidden process drift, carbon emissions, and CBAM penalties

Europe’s cement industry is entering a new operating reality, and it has little to do with market demand or fuel prices. With EU ETS carbon prices now exceeding €80–90 per tonne of CO₂ — and the Carbon Border Adjustment Mechanism becoming financially enforceable from January 2026 — energy inefficiency has crossed a threshold. It is no longer an internal operational concern. It is a priced carbon exposure, one that now directly shapes margins, export viability, and competitive positioning.


What makes this exposure difficult to manage is not the absence of technology. Most European cement plants already run DCS systems, maintenance platforms, and periodic energy reports. The problem is where the losses actually originate.


Most excess energy and carbon emissions in cement plants do not come from failures. They do not come from downtime, broken equipment, or obvious process upsets. They come from anomalies that persist quietly while the plant appears stable — gradual drifts in process behaviour that inflate specific energy consumption week over week, with no alarm, no throughput loss, and no visible signal until the carbon cost is already locked in.

The Carbon Arithmetic of Cement Production

Cement manufacturing accounts for roughly 6–8% of global CO₂ emissions — approximately 2.4 gigatonnes annually. The sources are well understood: chemical emissions from limestone calcination, and the energy intensity of thermal and grinding operations. In a typical integrated plant, thermal energy to the kiln and calciner accounts for 60–65% of total consumption; electrical energy for grinding, fans, and utilities makes up the remaining 35–40%.


The regulatory implication of this split is direct: any process deviation that increases GJ per tonne of clinker or kWh per tonne of cement also increases Scope 1 or Scope 2 emissions — even when throughput remains unchanged. There is no operational buffer between process inefficiency and carbon liability.


The EU BAT benchmark for a modern precalciner kiln sits at 3.0–3.2 GJ per tonne of clinker. A deviation of just 0.1 GJ per tonne on a one-million-tonne-per-annum clinker line translates to more than 100,000 GJ of excess energy annually and 7–9 kilotonnes of additional CO₂. At current EU ETS prices, that is a seven-figure carbon cost from a deviation that registers nowhere in standard KPI dashboards.

Where Energy Quietly Escapes

Kilns and Calciners: Burning Fuel Without a Warning

Kiln instability is among the least visible sources of thermal energy waste. False air ingress, cyclone pressure imbalance, alternative fuel calorific variability, and raw meal chemistry swings — particularly in lime saturation factor and silica modulus — can push specific heat consumption from the BAT benchmark of around 680 kcal per kilogram of clinker to 750 kcal or beyond. That is approximately 10% higher fuel consumption, with no production alarm and no throughput signal. By the time monthly energy reports capture the drift, the EU ETS liability has already accrued.

Vertical Roller Mills: Sensitivity That Operates at Scale

A well-operated VRM grinding circuit consumes 20–23 kWh per tonne of cement. Under unstable conditions — grinding bed instability, separator cut-size drift, excess circulating load — that figure climbs to 25–30 kWh per tonne. For a one-million-tonne-per-annum cement mill, a sustained drift of just three kWh per tonne represents 3 GWh of excess electrical consumption annually: roughly 1.2–1.5 kilotonnes of additional CO₂ at EU grid intensities. The process does not stop. Output continues. The energy inflation simply does not appear until the bill arrives.

Ball Mills: The Most Misleading Energy Risk

Ball mills represent a particular blind spot in legacy plants. Unlike VRMs, their inefficiency is structurally hidden. Sub-optimal grinding media charge, incorrect separator settings, high recirculation ratios, worn liners causing slip rather than breakage, and pinion-girth gear misalignment can collectively drive mill power consumption 15–20% above optimal — with no noticeable throughput loss and no immediate alarm. Specific energy typically ranges from 35–42 kWh per tonne under normal conditions. Under silent drift, that ceiling is regularly exceeded. KPIs appear normal. The plant appears stable. Scope 2 emissions quietly increase.

Fans: Silent Multipliers Across the Plant

Fans consume 20–30% of a cement plant’s total electrical load. Fouling, duct build-up, or mechanical imbalance can increase fan power draw by 10–15%. These losses almost never affect availability or throughput — they affect only energy intensity, and they accumulate invisibly across shift reports and monthly aggregations.

CBAM Changes the Penalty Structure

What CBAM introduces — beyond the carbon price itself — is a fundamentally different penalty logic. Under the previous operating model, carbon costs were partially absorbed, partially passed through, and managed as a macro-level cost line. CBAM changes this: from January 2026, cement and clinker imports face EU ETS-linked pricing based on embedded emissions, calculated at the level of the production process.


The implication is precise and consequential. CBAM does not penalise geography or fuel choice alone. It penalises process inefficiency. A plant running at 750 kcal per kilogram of clinker rather than 680 carries a structurally higher embedded emissions figure — and a structurally higher CBAM liability — regardless of where it is located or what fuel it burns.

CSRD: From Reported Numbers to Demonstrated Control

The Corporate Sustainability Reporting Directive adds a further dimension that is frequently underestimated. Under CSRD, cement producers are required to disclose not only energy intensity metrics but evidence of operational controls — demonstrable governance over the accuracy and reliability of sustainability data.


Manual, monthly energy aggregation cannot satisfy this requirement. It cannot explain why grinding instability occurred over a 48-hour window, why fan load trended upward across three shifts, or how refractory heat loss in the kiln contributed to a quarterly Scope 1 increase. Process-level explainability is now a regulatory expectation, not a reporting aspiration.

The Gap That Remains — and Where It Lives

European cement plants are not operating without data. They are operating with data that does not connect.


DCS systems show what is happening in the process. Maintenance systems explain why equipment eventually fails. Energy reports show how much energy was consumed — after the fact. What none of these provide is an integrated, real-time answer to the question that now carries direct financial consequence:


Which process deviation, combined with which emerging asset condition, is inflating kWh per tonne or kcal per kilogram right now — and by how much?


This is the gap where CBAM exposure accumulates and where CSRD obligations become difficult to defend. Closing it requires something that monitoring dashboards and periodic reports were never designed to deliver: continuous correlation across process behaviour, energy intensity, and asset health — followed by a recommendation that an operator can act on, validate, and trust.


This is precisely where Infinite Uptime’s Process Business, built on PlantOS™, operates.


PlantOS™ works at the process-energy interface — where deviations are still small, corrections are still low-cost, and carbon penalties can still be avoided. It identifies VRM separator drift before a sustained energy increase hardens into a reporting obligation. It flags kiln heat imbalance while fuel efficiency is still recoverable. It surfaces chronic ball mill over-consumption that no conventional dashboard has flagged — because throughput never dropped and no alarm ever fired.


Critically, the system does not act in isolation. Every recommendation is designed to be reviewed, validated, and owned by the operator on the floor. The outcome is not automation displacing judgment — it is agentic intelligence that accelerates it. Over time, each intervention that an operator validates becomes part of a continuously improving decision fabric: a record of what worked, under which conditions, on which assets.


The following Process Diagnostic Report, drawn from live cement plant deployments, show what this looks like in practice.

In the Field: What Operator-Validated Outcomes Look Like

Star Cement — Kiln Firing System Trip, Coal Extraction Fault

At Star Cement, SCL Line 2 Kiln stopped on 9 September at 18:35. PlantOS™ diagnosed the cause within the same operational window: the MB firing system had tripped because rotor scale current reached 25 amps — the H2 limit — due to material jamming in the coal extraction path from the bin to the rotor. The recommendation was precise: adjust aeration air pressure for the bin and rotor; implement regular rotor cleaning to prevent recurrence.


The operator validated and executed: Rotor Aeration adjusted to 0.8 kg/cm², Baby Bin Aeration set to 2.5 kg/cm², rotor gap confirmed at 0.3–0.35mm in discussion with the OEM. Customer comment logged: “Corrective action found effective.”


Business impact: approximately 2,000 tonnes of production protected, four breakdown hours saved.


This is not just a case study prepared for a presentation. This is Process Prescription Report generated by PlantOS™, acted & validated by plant operators, and time-stamped to the hour. The observation, diagnostic, recommendation, corrective action, and business impact are all in one record — auditable, explainable, and CSRD-ready.

The architecture above shows how PlantOS™ moves from raw plant data at the equipment and process layer (T1) through edge connectivity, platform execution, and prescriptive analytics (T2–T4), to decision planning, AI orchestration, and strategic governance (T5–T6). For cement energy management, the critical path runs through Process Canvas at T3 — which makes energy drift visible and explainable — and Process Prescript at T4, which converts correlated anomalies into timed operator actions. The 3–8% energy reduction validated at T4 is not a modelled estimate. It is an outcome confirmed by operators who acted on prescriptions, closed the loop, and logged the result.

This is what positions PlantOS™ as Industrial Agentic AI for Operator-Validated Outcomes — not a monitoring layer that surfaces data, but a decision layer that closes the loop between process intelligence, human judgment, and measurable operational impact.

In the CBAM and CSRD era, process control is carbon control. The plants that close this gap first will carry a lower embedded emissions figure, a stronger regulatory position, and a structurally more defensible cost base. The plants that do not will continue to discover the penalty after it has already been paid.
Infinite Uptime’s PlantOS™ helps European cement producers identify and correct energy-relevant process anomalies in real time — before they become carbon costs.

To explore what this looks like for your operations,
see here:
Get in touch here .
Categories
Energy Efficiency
Energy Efficiency, Innovation & Process Reliability:

Energy Efficiency, Innovation & Process Reliability: The Unseen Trio Driving Cement’s Net Zero Journey in Europe

Read Time: 8–9 minutes | Author – Kalyan Meduri

Energy Efficiency, Innovation & Process Reliability: The Unseen Trio Driving Cement’s Net Zero Journey in Europe

Net Zero Is Not a Cost — It’s a Multiplier


The European cement industry sits at the heart of one of heavy industry’s most complex decarbonisation challenges. Responsible for approximately 7% of global CO₂ emissions (UNECE/IEA), cement production is both energy-intensive and process-dependent. Yet leading producers — Holcim and Heidelberg Materials foremost among them — are demonstrating that Net Zero transformation can coexist with profitability, driven by three reinforcing pillars: energy efficiency, sustainability innovation, and process reliability.


However, a critical question remains: can the industry close the gap between digital insight and plant-floor execution? Research conducted by MIT Sloan Management Review India in collaboration with Infinite Uptime — surveying 48 senior industrial leaders across six countries — reveals that 81% of maintenance professionals rate current systems as only moderately effective at converting AI insights into action. This “execution gap” is not a technology problem alone. It is a trust problem, a context problem, and ultimately, a production-outcomes problem.

Energy Efficiency as a Profit Engine

Energy accounts for up to 30–40% of cement production costs, making efficiency a direct lever for profitability. European leaders have aggressively optimised thermal and electrical consumption through waste heat recovery systems, advanced kiln optimisation, and electrification paired with renewable power sourcing.


According to the IEA/OECD Technology Roadmap, improving energy efficiency is one of the primary carbon mitigation levers in the cement sector. EU best-in-class thermal efficiency targets are converging toward 3.16 GJ/ton clinker, demonstrating incremental gains through process optimisation.


Holcim, for instance, integrates energy-efficient building solutions and low-carbon cement products while aligning with Science Based Targets Initiative (SBTi)-validated net-zero pathways. The financial logic is clear:

Energy Lever Mechanism Financial Impact
Lower fuel consumption WHRS, kiln optimisation Reduced operating cost
Reduced carbon intensity Alternative fuels, clinker substitution Lower EU ETS carbon tax exposure
Electricity optimisation Renewable sourcing, load balancing Improved EBITDA margins

MIT SMR India Research Insight: The MIT Sloan Management Review India study finds that 50% of respondents report asset, process, and energy data are not linked in their current systems. Without this integration, energy optimisation remains siloed — divorced from the process context and maintenance realities that determine whether efficiency gains are sustained or eroded by unplanned downtime.

Sustainable Innovation Driving Revenue Growth

European cement majors are not just cutting emissions — they are monetising sustainability through premium green products and breakthrough carbon capture technology.

Heidelberg Materials: The Cement Plant
That Created a New Market01

At Norway’s coast, Heidelberg Materials’ Brevik plant is rewriting what “green cement” means. As the world’s first industrial-scale carbon capture and storage (CCS) facility in the cement industry — inaugurated in June 2025 as part of the Norwegian government’s Longship initiative — the plant captures 400,000 tonnes of CO₂ every year, equivalent to 50% of its total emissions. The result is evoZero®, the world’s first carbon-captured near-zero cement, now being delivered to customers across Europe. Early adopters include Oslo’s new Skøyen Station and the DREIHAUS 3D-printing housing project in Germany.

Holcim: Turning Lower Emissions into
Higher Market Value02

Holcim’s low-carbon cement portfolio, engineered with 30%+ lower CO₂ intensity, targets premium green construction projects. The strategy is direct: cut emissions, raise demand, lead the market.

Key Decarbonisation Levers

  • Clinker substitution: up to 40% emission reduction potential
  • Alternative fuels: approximately 25% reduction contribution
  • Carbon capture: largest long-term impact; European studies show combining these measures can reduce emissions by 58% without CCS and up to 88% with CCS by 2050

The European cement industry is steering towards a 37% CO₂ cut by 2030 and Net Zero by 2050. But these targets are not achievable through innovation alone. They require the silent third pillar: process reliability.

Process Reliability: The Hidden Driver of Net Zero Success

While energy efficiency and sustainability innovation capture headlines, process reliability is the silent enabler of both. Cement plants operate continuous high-temperature processes (>1400°C) where unplanned downtime leads to massive energy losses, production inefficiencies, and increased emissions per tonne.


This is where the MIT Sloan Management Review India research delivers a sobering reality check. The study’s findings reveal that the industry’s biggest challenge is not the absence of AI — it is the persistent gap between AI-generated insight and reliable plant-floor execution.

The Contextualization Gap: Why Models
Fail in Real Plants01

The MIT SMR India study identifies a “Contextualization Gap” that directly constrains prediction accuracy and, by extension, process reliability outcomes:

  • 62% of respondents: cite data fragmented across multiple systems as the single most referenced barrier to effective AI deployment.
  • 71%: lack sufficient context regarding process constraints — including safety boundaries and throughput commitments.
  • 59%: report inadequate maintenance history, often due to uninterpreted paper logs or knowledge retained informally by veteran technicians.
  • 53%: lack visibility into throughput interdependencies, limiting a model’s ability to understand how a single asset failure propagates downstream.

Key Finding: Data quality and availability constraints do not merely reduce prediction accuracy at the margins. They define the ceiling of accuracy that any model can achieve, regardless of its architectural sophistication.

The Trust Threshold: Why Operators Withhold Confidence02

The research reveals that confidence in industrial AI behaves as a threshold rather than a gradual progression. The industry remains in a state of withheld judgement:

  • 44% of respondents: remain neutral — awaiting plant-specific proof of reliability before committing trust.
  • 56%: cite false positives as the primary trust eroder, generating alert fatigue and reducing willingness to act.
  • 38%: report breakdowns at the point of execution — where an alert identifies an issue but does not clearly specify how to execute the repair within operational and safety constraints.

As one maintenance professional in the MIT SMR India study observed: in complex brownfield plants, 80% of flagged anomalies represent operational changes rather than mechanical defects. At this ratio, repeated investigation of non-actionable alerts erodes trust across all AI outputs.

Why Process Reliability Matters to Net Zero
Reliability Condition Net Zero Impact
Stable kilns Optimal fuel consumption, lower specific energy
Reduced unplanned breakdowns Lower waste, reduced reprocessing, fewer emission spikes
Consistent operations Predictable emissions, reliable ESG reporting
Higher uptime → higher throughput Amortises fixed-cost decarbonisation investments across more tonnes

How PlantOS™ Closes the Loop: From Insight to Validated Outcome

To fully unlock the convergence of energy efficiency, innovation, and process reliability, cement manufacturers need more than monitoring dashboards or disconnected predictive tools. They need a prescriptive AI platform that closes the loop between prediction and validated outcome. This is where Infinite Uptime’s PlantOS™ becomes critical.


The MIT SMR India research introduces the Trust Loop framework — a structured cycle where machine data, human expertise, and operational execution converge. PlantOS™ operationalises this framework through four interdependent phases:

Trust Loop Phase What PlantOS™ Delivers Net Zero Impact
Deep Asset Contextualization Integrates data from PLCs, DCS, SCADA, energy meters, CMMS, and ERP into a single operational layer Asset-level energy tracking; eliminates fragmented data silos
Prediction & Prescription Quality Context-aware failure detection with root cause identification and actionable maintenance guidance Prevents unplanned downtime; reduces emission spikes from restarts
Operational Execution Human-in-the-loop validation; prescriptions embedded into maintenance workflows Higher MTBF; consistent operations = predictable emissions
Validation & Verification Post-intervention performance verification; user-validated outcomes logged Real-time ESG reporting; attributable ROI for decarbonisation investments

Field Evidence: The Star Cement Deployment

At Star Cement, PlantOS™ was deployed across four plants, integrating data from 19 existing systems — PLCs, DCS, energy meters, SAP, maintenance logs, and quality reports — without adding new sensors. The deployment created plant-wide context from existing infrastructure, delivering:

  • 46 hours: of prevented unplanned downtime
  • 10 tons/hour: increase in throughput
  • ~920,000 kcal: reduction in specific heat consumption
  • ~5%: lift in Mean Time Between Failures
  • 10x ROI: in under six months
  • 99%: of prescriptions acted upon and outcomes validated by plant teams

“The biggest change was the immediate establishment of a single source of truth. We moved from reactive chaos to proactive control.”— Dhawan Soni, Electrical and Instrumentation Head, Star Cement

The Contextualization Gap: Why Models
Fail in Real Plants01

The MIT SMR India study identifies a “Contextualization Gap” that directly constrains prediction accuracy and, by extension, process reliability outcomes:

  • 62% of respondents: cite data fragmented across multiple systems as the single most referenced barrier to effective AI deployment.
  • 71%: lack sufficient context regarding process constraints — including safety boundaries and throughput commitments.
  • 59%: report inadequate maintenance history, often due to uninterpreted paper logs or knowledge retained informally by veteran technicians.
  • 53%: lack visibility into throughput interdependencies, limiting a model’s ability to understand how a single asset failure propagates downstream.

Key Finding: Data quality and availability constraints do not merely reduce prediction accuracy at the margins. They define the ceiling of accuracy that any model can achieve, regardless of its architectural sophistication.

This directly addresses the MIT SMR India finding that 70% of Digital and IT leaders report uncertainty about which system serves as the authoritative source of asset context — even in organisations that consider their technology stacks fully integrated.

Energy Efficiency as a Profit Engine

Energy accounts for up to 30–40% of cement production costs, making efficiency a direct lever for profitability. European leaders have aggressively optimised thermal and electrical consumption through waste heat recovery systems, advanced kiln optimisation, and electrification paired with renewable power sourcing.


According to the IEA/OECD Technology Roadmap, improving energy efficiency is one of the primary carbon mitigation levers in the cement sector. EU best-in-class thermal efficiency targets are converging toward 3.16 GJ/ton clinker, demonstrating incremental gains through process optimisation.


Holcim, for instance, integrates energy-efficient building solutions and low-carbon cement products while aligning with Science Based Targets Initiative (SBTi)-validated net-zero pathways. The financial logic is clear:

Energy Lever Mechanism Financial Impact
Lower fuel consumption WHRS, kiln optimisation Reduced operating cost
Reduced carbon intensity Alternative fuels, clinker substitution Lower EU ETS carbon tax exposure
Electricity optimisation Renewable sourcing, load balancing Improved EBITDA margins

MIT SMR India Research Insight: The MIT Sloan Management Review India study finds that 50% of respondents report asset, process, and energy data are not linked in their current systems. Without this integration, energy optimisation remains siloed — divorced from the process context and maintenance realities that determine whether efficiency gains are sustained or eroded by unplanned downtime.

Key Takeaways

  • Energy Efficiency = Direct Profitability: Every kilowatt saved reduces cost and carbon exposure simultaneously. But efficiency gains are only sustained when equipment runs reliably.
  • Sustainable Innovation = New Revenue Streams: Green products like evoZero® are creating premium markets. But process reliability determines whether these innovations deliver at scale.
  • Process Reliability = The Foundation for Net Zero: MIT SMR India’s research confirms that trust in AI is an evidence challenge, not a technology challenge. Practitioners need real use cases from comparable plants, contextually grounded models, and validated outcomes.
  • The Trust Loop Is the Missing Operating Layer: Companies that close the loop between context, prediction, execution, and validation — as PlantOS™ enables — convert digital investment into measurable production impact across MTBF, efficiency, and throughput.

European cement leaders are proving that Net Zero is not a cost burden — it is a strategic growth lever. Companies like Holcim and Heidelberg Materials are aligning energy efficiency, sustainability innovation, and process reliability to unlock both environmental and financial value.


However, achieving this at scale requires a digital backbone that earns operator trust through demonstrated, validated outcomes. Platforms like Infinite Uptime’s PlantOS™ act as the operational intelligence layer — ensuring that every kilowatt saved, every emission reduced, and every hour of uptime contributes directly to both Net Zero targets and profitability.


As the MIT SMR India research concludes: trust begins with context and is reinforced through demonstrated accuracy under real operating conditions. The next phase of industrial AI adoption lies in closing the gap between credible prediction and disciplined execution.

Sources & References
  • https://www.heidelbergmaterials.com/system/files/2026-03/HM_ASR25_en.pdf
  • https://www.holcim.com/sustainability/esg/esg-policies-documents-reports
  • https://www.holcim.com/sites/holcim/files/docs/27022026-holcim-sustainability-statement-2025.pdf
  • https://www.verdantix.com/insights/blog/energy-costs-are-forcing-energy-management-up-the-agenda
  • https://www.mdpi.com/2071-1050/13/7/3810
Categories
Energy Efficiency
The Energy Problem Plants Are Solving Wrong

The Energy Problem Plants Are Solving Wrong How Process Stability — Not Equipment Upgrades — Unlocks Industrial Energy Efficiency

Read Time: 8–9 minutes | Author – Kalyan Meduri

The Energy Problem Plants Are Solving Wrong How Process Stability — Not Equipment Upgrades — Unlocks Industrial Energy Efficiency

Most industrial energy reduction programmes start in the wrong place. They audit equipment specifications. They upgrade motors. They install variable frequency drives. And then they wonder why the energy bills barely move.

Here is what the equipment audit misses: a 2% deviation in operating parameters can increase energy consumption by 8–12% in rotating equipment. That deviation is not a hardware problem. It is a stability problem — and most plants have no reliable way to detect it until a motor fails, a kiln trips, or a compressor seizes.

The real lever for industrial energy efficiency is not what your equipment is rated for. It is how consistently that equipment actually operates. And closing that gap — between rated efficiency and real-world efficiency — requires something most energy programmes are not designed to deliver: process stability at machine level.

A 2% deviation in operating parameters can increase energy consumption by 8–12% in rotating equipment. Most plants have no way to detect it until failure.

What Process Stability Actually Means (And What It Does Not)

Process stability is not the same as process control. Control systems regulate setpoints. Stability describes whether machines are operating within their most efficient performance envelope — consistently, over time, across shifts.

In practice, instability shows up as:

  • Vibration signatures that indicate misalignment, imbalance, or bearing degradation
  • Load fluctuations that force motors to draw excess current
  • Temperature deviations that signal lubrication breakdown or thermal inefficiency
  • Unplanned stops that trigger energy-intensive restart cycles

None of these appear in an equipment spec sheet. All of them have a direct, measurable cost on the energy line.

The Mechanics : Why Stability and Energy Are the Same Problem

The physics is straightforward. Industrial equipment is designed to operate at peak efficiency within a narrow band. Deviate from that band — through vibration, imbalance, thermal stress, or load variation — and friction increases, resistance increases, and the motor draws more power to maintain output. The machine is doing more work to produce the same result.


Add unplanned downtime to that picture and the energy cost compounds. Restarting a cement kiln, a large compressor, or a hot rolling mill consumes multiples of the energy required to maintain steady operation. Every unplanned stop is not just a production loss — it is an energy spike that erases hours of efficiency gains.


Industry research consistently shows that mechanical losses from unstable operation account for 15–25% of preventable energy waste in heavy manufacturing. That figure dwarfs most ROI projections on equipment upgrade programmes.

Where Industrial AI Has Failed — And What Changes That

Awareness of this problem is not new. What is new is the technology to act on it — and the industry’s still-evolving ability to do so at scale.

The industrial AI sector has spent a decade building predictive maintenance tools. Most of them generate alerts. Operators receive a notification that a bearing is degrading, that vibration is trending upward, that a temperature threshold has been breached. The research record on what happens next is not encouraging: industry data suggests that more than 90% of industrial AI pilots fail to reach sustained production deployment. The alerts are accurate. The gap between alert and action is where the value evaporates.

This is the distinction that matters for energy efficiency. Predictive maintenance tells you something is wrong. Prescriptive maintenance tells you exactly what to do about it, in language an operator can act on immediately, validated against outcomes that have already been proven.

Predictive maintenance creates alerts. Prescriptive maintenance closes work orders. Only one of those eliminates energy waste.

The difference is not semantic. When a maintenance team receives an alert, they must diagnose, prioritise, resource, and schedule. Each step introduces delay. During that delay, the unstable machine continues drawing excess energy. The longer the loop between detection and correction, the greater the cumulative energy loss.


Prescriptive systems compress that loop. They contextualise the anomaly, identify the probable root cause, recommend a specific corrective action, and assign confidence levels to each recommendation. The result is not a notification to investigate. It is an instruction to act.

What This Looks Like at Scale : JSW Steel

Abstract arguments about stability and energy efficiency are easy to make. The harder question is whether this works at industrial scale, under real operating conditions, across a heterogeneous asset base.


JSW Steel — one of the largest steel producers in Asia — deployed Infinite Uptime’s PlantOS platform across 139 plants. The outcomes at scale:

downtime
hours eliminated
0
operator adoption
rate across all sites
0 %
AI-assisted work
orders completed
0

The adoption figure is the one worth dwelling on. Industrial AI deployments routinely report high technical accuracy and low adoption. The gap between the two is where most programmes die. A 93% operator adoption rate across 139 plants is not a technology story. It is a trust story — evidence that the prescriptions being generated are credible, actionable, and consistently validated by the people closest to the machines.


That trust, once established, changes the economics of energy efficiency. When operators act on AI-generated prescriptions consistently, the loop between instability and correction closes. Machines return to their optimal operating bands faster. Energy consumption stabilises. The efficiency gains compound across shifts, across plants, across years.

What This Looks Like in Cement : Star Cement

If JSW Steel demonstrates the model at enterprise scale across metals, Star Cement demonstrates it at plant-level depth in one of the world’s most energy-intensive manufacturing processes.


Star Cement — a leading Asian OPC & PPC manufacturer — deployed PlantOS across four plants covering the full production chain: from mines and raw material handling through kiln, cooler, grinding, WHRS, and captive power plant. The integration scope was total: 19 systems (PLCs, DCS, energy meters, SAP, logbooks, quality systems), 492 KPIs monitored continuously, 0 missed faults.


The prescriptions were not generic recommendations. Two examples from the Star Cement diagnostic record illustrate the specificity:

  • A raw mill tripping repeatedly due to high vibration was diagnosed to high moisture in CFA (10–20%). The prescription: reduce CFA below 10% and cover material transport. The business impact: 5–10 TPH mill throughput restored.
  • A kiln main drive trip was traced to roller-3 bearing temperature rising from 30 to 60°C. The prescription: inspect lubrication oil level, improve cooling water circulation, maintain kiln shell temperature below 250°C. The business impact: 1,000 T production saved, 2–3 hours of breakdown hours eliminated, 20–50 kcal/kg clinker SHC saved.

These are not alerts. They are instructions with predicted business impacts, completed as closed work orders, validated by Star Cement’s own engineering teams.


The aggregate outcome across six months, user-validated:

Specific Heat Consumption saved
0 K kcal
unplanned downtime eliminated
0 hrs
throughput increase
0 TPH
ROI in under 6 months — ₹47.8M (~$536K USD) annual savings
0 X

The biggest change was the immediate establishment of a single source of truth.

We moved from reactive chaos to proactive control.”

Mr. Dhawan Soni, E&I Head, Star Cement

The 99% prescription act-on rate at Star Cement — matched against 99.97% prediction accuracy and zero missed faults — is the metric that explains the energy outcome. Every prescription acted upon is one more machine returned to its optimal operating band. Every machine in its optimal band is one less source of thermal inefficiency, friction loss, and energy drain. The energy savings are the aggregate of those individual corrections, compounding across plants, across shifts, across six months.

Where Process Stability Has the Highest Energy Leverage

The principle applies across heavy industry, but the magnitude of impact varies. The sectors with the greatest energy leverage from stability programmes share a common characteristic: they operate energy-intensive continuous processes where small deviations have outsized consequences.

Cement Manufacturing

Kilns and grinding circuits in cement plants operate continuously and represent 60–80% of total site energy consumption. Vibration in grinding mills, misalignment in kiln drives, and thermal instability in preheater systems all drive energy waste that conventional monitoring cannot resolve at speed.


Star Cement — one of Asia’s leading OPC & PPC manufacturers — demonstrates exactly what prescriptive AI delivers in this environment. Across four plants and 19 integrated systems spanning PLCs, DCS, energy meters, and quality infrastructure, PlantOS monitored 492 critical KPIs and generated specific corrective prescriptions. In under six months, Star Cement’s own engineering teams validated: 920,000 kcal saved in Specific Heat Consumption, 46 hours of unplanned downtime eliminated, throughput raised by 10 TPH, and 600 tons of clinker production preserved — translating to ₹47.8 million (~$536,000 USD) in annual savings. ROI: 10x in less than six months.

“The biggest change was the immediate establishment of a single source of truth.

We moved from reactive chaos to proactive control.”


— Mr. Dhawan Soni, E&I Head, Star Cement

The energy outcome here is worth unpacking specifically. The 920,000 kcal reduction in Specific Heat Consumption was not achieved by installing new equipment. It was achieved by stabilising existing equipment: detecting a kiln roller bearing temperature rising from 30 to 60°C before it caused a main drive trip, prescribing lubrication oil replacement and water circulation, and closing the work order before the fault cascaded. Each intervention of that kind not only prevents a downtime event — it eliminates the energy spike of a kiln restart and restores the thermal efficiency the instability had been quietly eroding.

Steel and Metals Processing

Heavy rotating equipment in rolling mills, compressor stations, and furnace drives operates under extreme load variability. Instability-driven energy losses in these environments are measurable within hours. JSW Steel’s results demonstrate what is achievable when those losses are systematically addressed at plant level.

Chemicals and Process Industries

Continuous process environments require precision operating conditions. Deviations from optimal parameters drive both energy waste and product quality variation. Stability and quality are the same intervention.

Power Generation

In power generation, equipment reliability directly determines output efficiency. Turbine vibration, auxiliary system instability, and thermal deviations all reduce net generation per unit of fuel consumed.

The Next Frontier : Semi-Autonomous Energy Optimisation

The trajectory of industrial AI is moving beyond human-in-the-loop decision support. The emerging model is what might be called Semi-Autonomous Execution — where AI-generated prescriptions are validated, refined, and in some cases executed with minimal human intervention, without adding headcount.

In energy terms, this means systems that do not merely identify instability but continuously recalibrate operating parameters in response to real-time machine health data. The gap between rated efficiency and actual efficiency narrows not just during planned interventions, but continuously, across every operating hour.

The industrial organisations that are building toward this capability now are not doing so because they have solved every technical challenge. They are doing so because the competitive and regulatory pressure on energy performance is not decreasing — and the organisations that have already built operator trust in AI-generated prescriptions will be the ones able to deploy autonomous systems at speed when the technology matures.

The energy crisis in heavy manufacturing is not a technology problem. It is a stability problem that most technology programmes are not designed to solve.

How Infinite Uptime Approaches This

Infinite Uptime built PlantOS as a prescriptive AI platform — not an analytics dashboard, not an alert engine. The core design principle is that a system’s value is measured not by the accuracy of its predictions but by the rate at which its recommendations are acted upon and validated by operators.


The architecture reflects that principle. PlantOS contextualises machine health data — vibration, temperature, load, current — against operational baselines to generate prescriptions that tell maintenance teams not just that something is wrong, but what to do, when, and why. Those prescriptions are validated in the field and fed back into the model. The result is a system that becomes more accurate and more trusted over time.


Across JSW Steel, Star Cement, Vedanta, and Indorama, the pattern holds: high prescription accuracy, high operator adoption, measurable outcomes at P&L level. That is the trust loop that makes sustained energy efficiency possible.

Conclusion

The energy crisis in heavy manufacturing is not primarily a technology problem. The technology to monitor, analyse, and act on machine health data exists. The problem is a stability problem: the gap between what machines are designed to do and how they actually operate, shift after shift, plant after plant.


Closing that gap requires more than sensors and dashboards. It requires prescriptive intelligence that operators trust enough to act on, at the speed instability demands. When that trust is established, the energy efficiency gains are not marginal. They are structural.


The manufacturers that are solving this problem now are not waiting for the next equipment cycle. They are building the operator trust, the data infrastructure, and the prescriptive systems that will determine their energy and competitive position for the next decade.

Read More on Industrial Energy Efficiency

Frequently Asked Questions

Most programmes focus on equipment specifications rather than operating behaviour. A motor rated at 95% efficiency may operate at 78% efficiency under unstable conditions. The gap between rated and actual performance is where the energy is lost — and it is invisible to programmes that do not monitor machine stability continuously.

Predictive maintenance generates alerts when anomalies are detected. Prescriptive maintenance generates specific corrective actions, ranked by confidence, that operators can execute immediately. Only prescriptive systems close the loop between detection and correction fast enough to prevent energy losses from accumulating.

In rotating-equipment-heavy environments such as cement and steel, measurable gains are typically visible within the first quarter of deployment. Long-term structural gains compound as operator adoption increases and the AI system accumulates validated outcome data.

Prescriptions that are not acted upon have no energy impact. High adoption rates — such as the 93% achieved across JSW Steel’s 139 plants — mean that the loop between instability detection and corrective action closes consistently. It is the act-on rate, not the detection rate, that determines energy performance.

The underlying physics applies regardless of plant size. The economics become most compelling at scale, but the entry point for stability-based energy programmes has reduced significantly as IIoT sensor costs and cloud-based AI platforms have matured.

Categories
Energy Efficiency
The U.S. Steel Plant Reliability Crisis

The U.S. Steel Plant Reliability Crisis

Read Time: 5–6 minutes | Author – Kalyan Meduri
Side profile of a bearded male worker in high-visibility clothing and safety goggles using a glowing blue touchscreen. The background shows a blurred industrial workshop, emphasizing the integration of AI and smart technology in labor.
This blog breaks down what is driving the steel reliability squeeze, which failure modes matter most, and how a 99% Trust Loop mindset shifts reliability from “alerts” to “outcomes.”

Key Takeaways

01 U.S. steel plant reliability is under pressure from harsh operating conditions and aging assets
02 Steel mill downtime is commonly driven by lubrication issues, bearing failures, and gearbox reliability problems
03 Predictive maintenance and condition monitoring alone are not enough
04 Prescriptive maintenance improves decision making and execution
05 The 99% Trust Loop connects detection, action, and validation
U.S. steel plant reliability is facing a real crisis. Aging infrastructure, extreme operating conditions, and increasing production pressure have made steel mill downtime more frequent and more costly. For plant managers, reliability is no longer a background maintenance issue. It is a core operational risk that directly impacts throughput, safety, and margin.
Steel plants operate some of the most punishing assets in North American manufacturing. Continuous duty cycles, extreme heat, vibration, dust, scale, and water exposure accelerate wear across rolling mills, gearboxes, bearings, and auxiliary systems. When steel plant maintenance programs fall behind, the result is cascading downtime across the entire operation.
The problem is that reliability has become harder to protect at exactly the time steel leaders need it most. Energy costs, margin pressure, and customer delivery expectations have raised the penalty of downtime. Public disclosures in the sector show how real these events are, including unplanned outages that force operational workarounds to recover production volume.
At the broader manufacturing level, downtime is increasingly being framed as an enterprise risk rather than an inconvenience. A 2025 survey cited by Fluke reported major capital impacts tied to unplanned downtime and frequent incident rates among manufacturers.

Why steel reliability is uniquely fragile

Most steel plants already use historians, PLC data, vibration routes, and condition monitoring systems. The issue is not visibility. The issue is execution.
U.S. steel plant reliability is uniquely fragile because:
  • Assets are tightly coupled. A single gearbox or bearing failure can stop an entire rolling mill.
  • Operating conditions accelerate degradation. Heat and contamination attack lubrication systems and seals, while vibration increases fatigue.
  • Maintenance windows are constrained. Narrow outages force teams to delay corrective work.
  • Alert fatigue erodes trust. When condition monitoring produces false positives, teams hesitate to act.
In high-duty gearbox applications, even “small” internal components can cause outsized consequences. An AIST technical article on gearbox reliability highlights that bearings may be a small portion of gearbox cost, but can drive major production losses when premature damage removes a gearbox from service unexpectedly.

The most common failure drivers in steel plants

Steel mill downtime rarely comes from a single sudden event. Most failures follow a predictable chain that can be addressed through prescriptive maintenance.

Lubrication breakdown and contamination

High temperatures, water ingress, and particulate contamination reduce oil film strength and accelerate wear.

Bearing failures and misalignment

Thermal growth, soft foot, and alignment drift increase bearing loads, driving vibration and temperature increases.

Gearbox reliability degradation

As bearing condition deteriorates, gear mesh patterns degrade. Debris circulates through the lubrication system, accelerating damage.

Rolling mill reliability loss

Before catastrophic failure, rolling mills experience speed reductions, thickness variation, scrap increases, and forced slowdowns.
These failure modes are common across steel plant maintenance programs that rely only on reactive or predictive approaches.

Why traditional “predictive maintenance” often stalls in steel

Many steel producers have invested heavily in predictive maintenance and condition monitoring tools. Yet steel mill downtime persists.
Two issues consistently limit results:
  • Low actionability. Alerts identify problems but do not prescribe what to do next.
  • Low trust. False positives and unclear root causes delay decisions.
As a result, steel plant maintenance teams continue to rely on reactive repairs and emergency work orders.

How prescriptive maintenance improves steel plant reliability

Prescriptive maintenance goes beyond predicting failure. It provides clear, prioritized guidance on what action to take and when.
In steel environments, prescriptive maintenance:
  • Connects condition monitoring signals to specific failure modes
  • Recommends prioritized corrective actions
  • Aligns maintenance work with production schedules
  • Validates that interventions prevented downtime
This approach is delivered through the PlantOS™ prescriptive AI platform, which is designed for harsh industrial environments like steel.

The 99% Trust Loop approach for steel reliability

The 99% Trust Loop ensures that prescriptive maintenance insights lead to real outcomes.
In practice, the Trust Loop works by:
  1. Detecting early failures with high confidence using condition monitoring
  2. Prescribing the next best maintenance action
  3. Validating outcomes to confirm risk reduction
By closing this loop, steel plant maintenance teams move from alert monitoring to reliability ownership.

What plant managers should prioritize first

Plant managers focused on improving U.S. steel plant reliability should prioritize:

Critical assets that stop production

Rolling mill drives, main gearboxes, cranes, and casters that create immediate steel mill downtime when they fail.

Failure modes with long lead times

Bearing failures, lubrication degradation, and gearbox wear that can be detected weeks in advance.

Execution over inspection

Programs must convert insights into planned work using prescriptive maintenance, not just inspection reports.

The 99% Trust Loop

Find out how ‘The 99% Trust Loop’ @PlantOS™ delivered 3 User Validated Outcomes in 1 Prescription:

If your reliability program is generating alerts but not outcomes, it is time to close the loop.
Talk to Infinite Uptime about deploying PlantOS™ in steel environments to improve trust, accelerate maintenance decisions, and reduce unplanned downtime.

A friendly light-blue cartoon robot with a round head and screen face showing glowing green eyes stands upright, featuring a chest circuit-board icon above the Infinite Uptime infinity logo
Categories
Energy Efficiency
Downtime Is Draining Your EBITDA: The Real Role of Industrial Energy Efficiency

Downtime Is Draining Your EBITDA: The Real Role of Industrial Energy Efficiency

Read Time: 5–6 minutes | Author – Kalyan Meduri
industrial energy inefficiency leading to unplanned downtime in manufacturing
Downtime rarely starts with a breakdown. It often begins quietly—through rising energy consumption, unstable processes, and small inefficiencies that go unnoticed on the shop floor. Over time, these issues compound into unplanned stoppages, lost output, and shrinking margins. Industry studies show that unplanned downtime costs manufacturers between 5% and 20% of annual production capacity, while in energy-intensive operations, even a 1–2% increase in energy consumption per unit can translate into millions in lost margin annually. Yet in many plants, the challenge isn’t the lack of data—it’s the lack of confidence to act on insights at scale, a gap highlighted by the fact that 95% of GenAI pilots fail to move beyond experimentation.

Across manufacturing plants in the USA, EU, and India, this pattern is becoming increasingly common. Energy prices are volatile, operational pressure is rising, and yet many plants still treat energy efficiency as a secondary concern. In reality, energy inefficiency is one of the earliest indicators of downtime and a direct threat to EBITDA(Earnings Before Interest, Taxes, Depreciation, and Amortization). This is why approaches such as the 99% Trust Loop, which ensure AI-driven recommendations are trusted, acted upon, and validated by operators, are becoming critical to turning energy efficiency into consistent, real-world production outcomes.

Key Takeaways

01 Downtime has a direct EBITDA impact, increasing hidden costs through energy waste, process instability, and lost production—making it a financial risk, not just a maintenance issue.
02 Energy inefficiency is often the earliest warning sign of downtime, appearing well before equipment failure or unplanned stoppages occur.
03 Traditional monitoring tools provide data, but Prescriptive AI enables confident action, helping teams move from insight to execution on the shop floor.
04 The 99% Trust Loop ensures AI-driven recommendations are trusted, acted upon, and validated, enabling consistent and scalable operational improvements.
05 Industrial energy efficiency focused on stability—not just savings—helps manufacturers reduce downtime, protect margins, and improve long-term profitability.

Why Downtime Quietly Erodes EBITDA Before Anyone Notices

Key Definitions:
  • EBITDA (Earnings Before Interest, Taxes, Depreciation, and Amortization):
    A financial metric that reflects a plant’s operating profitability. In manufacturing, downtime and energy inefficiency directly reduce EBITDA by increasing costs and reducing output.
  • Industrial Energy Efficiency:
    The practice of optimizing energy use across machines, processes, and plants to reduce consumption and cost without compromising productivity, quality, or reliability.
  • Prescriptive AI:
    An advanced form of AI that goes beyond prediction to recommend specific, actionable steps operators can take to prevent failures, reduce inefficiencies, and stabilize operations.
  • 99% Trust Loop:
    A closed-loop framework where AI-driven recommendations are trusted by operators, acted upon on the shop floor, and validated through real outcomes, ensuring consistent execution at scale.
When downtime occurs, the financial impact goes far beyond lost production hours. Every stop-and-start cycle increases energy usage, stresses equipment, and destabilizes processes. Restarting machines consumes significantly more power than steady-state operation, while process drift during recovery often leads to quality losses and rework.
What makes this especially damaging is that these costs don’t appear immediately on maintenance reports. They show up later as higher energy bills, inconsistent output, delayed deliveries, and rising operational expenses directly affecting EBITDA.
Downtime rarely appears as a single catastrophic failure. More often, it shows up through small, recurring operational losses that quietly erode margins.
  • Situation 1: Energy Spikes Before a Breakdown
    A critical motor begins consuming more energy than normal due to misalignment or bearing wear. It could be established from equipment + process contextualization, if the fault is mechanical, electrical, or process induced. Production continues, but energy cost per unit rises week after week. When the motor finally fails, the plant not only loses production time but has already paid a hidden penalty through excessive energy consumption—directly reducing EBITDA.
  • Situation 2: Stop–Start Operations Increase Hidden Costs
    A line experiences frequent micro-stoppages. Each restart consumes significantly more power, increases thermal stress, and destabilizes the process. While downtime reports show only minutes lost, the real impact appears later as higher electricity bills, lower yield, and increased maintenance spend.
  • Situation 2: Stop–Start Operations Increase Hidden Costs
    A line experiences frequent micro-stoppages. Each restart consumes significantly more power, increases thermal stress, and destabilizes the process. While downtime reports show only minutes lost, the real impact appears later as higher electricity bills, lower yield, and increased maintenance spend.
In all cases, energy inefficiency appears before downtime. Plants that treat energy behavior as an early warning system can intervene sooner, stabilize operations, and protect margins—long before maintenance teams are forced into reactive mode.

Energy Inefficiency Is the First Symptom of Operational Failure

Energy inefficiency is not just about higher consumption. It is often a symptom of deeper operational instability. When equipment begins to degrade or processes drift from optimal conditions, energy usage usually increases first long before a failure occurs.
Plants that monitor energy in isolation without equipment + process contextualization often miss this signal. However, when energy behavior is contextualized alongside production equipment and process data, it becomes a powerful early indicator. Recognizing and addressing these patterns early allows teams to correct issues before they escalate into downtime.

Why Traditional Energy Monitoring Fails to Prevent Downtime

Most manufacturing facilities already have energy meters and dashboards. The challenge isn’t lack of data, it’s lack of clarity. Traditional systems show what happened but rarely explain why it happened or what should be done next.
Without actionable guidance, teams are left to interpret alerts on their own. Over time, this leads to alert fatigue, reduced trust in systems, and delayed responses. Energy inefficiencies remain unresolved, and downtime continues to occur unexpectedly. This is where modern industrial energy efficiency solutions fundamentally differ.

How Industrial Energy Efficiency Protects Uptime and Margins

Modern energy efficiency solutions focus on stability, not just savings. By connecting energy data with process and equipment behavior, plants gain the ability to understand cause-and-effect relationships in real time.
When energy efficiency is managed correctly, it helps plants:
  • Detect abnormal operating conditions early
  • Reduce process variability
  • Maintain steady production without overloading equipment
These three outcomes alone have a significant impact on uptime and cost control. Stable processes consume less energy, experience fewer failures, and deliver more predictable output—directly supporting EBITDA.

Energy Efficiency Across the Plant Lifecycle

Energy losses are often designed into processes long before operations begin. Poor layout decisions, inefficient process sequencing, or energy-heavy operating windows create inefficiencies that persist for years. Digital modeling and simulation now allow manufacturers to identify and eliminate many of these issues early.
During production planning, energy-aware scheduling helps avoid peak loads and unnecessary stress on equipment. In daily operations, continuous optimization keeps processes within optimal ranges, reducing both energy waste and failure risk.
When energy efficiency is embedded across design, planning, and operations, it becomes a sustained advantage rather than a short-term fix.
One Challenge, Different Regions — Same Outcome
Whether in the USA and EU, where energy costs and regulations are high or in India where rapid growth and cost sensitivity dominate, the objective remains the same: reduce energy waste without disrupting production.
Plants that succeed do not chase energy reduction alone. They focus on operational stability, knowing that stable plants are naturally more energy-efficient and more profitable.
What This Means for EBITDA, Uptime, and Margins
When energy efficiency is aligned with uptime goals, manufacturers typically see:
  • Lower energy cost per unit
  • Fewer unplanned stoppages
  • Improved production consistency
  • Stronger margin protection
Even small, sustained improvements in energy behavior can deliver meaningful EBITDA gains over time.

Final Takeaway

Downtime is not just a maintenance issue—it is a direct financial risk. In most plants, energy inefficiency is the earliest signal that processes are drifting, equipment is under stress, and unplanned downtime is approaching. Manufacturers that treat energy efficiency as a core operational discipline, rather than a standalone sustainability or cost-saving effort, gain stronger control over uptime, costs, and margins. In today’s volatile energy and production environment, stability—not just savings—defines profitability.

This is where Infinite Uptime’s PlantOS™ makes a measurable difference. Powered by Prescriptive AI and the 99% Trust Loop, PlantOS™ moves beyond prediction to deliver recommendations that operators trust, act on, and validate on the shop floor. By continuously linking energy behavior with process and equipment performance, PlantOS™ helps plants identify inefficiencies early, prescribe targeted actions, and sustain energy and uptime improvements at scale. The outcome is a more stable, resilient, and profitable operation—where energy efficiency directly supports production outcomes and EBITDA.

Find out how ‘The 99% Trust Loop’ @PlantOS™ delivered 3 User Validated Outcomes in 1 Prescription: https://youtu.be/110BHAJTldA

The 99% Trust Loop

Find out how ‘The 99% Trust Loop’ @PlantOS™ delivered 3 User Validated Outcomes in 1 Prescription:

Close the Trust Loop in Your Plant.
Join 841 plants using PlantOS™ to achieve up to
40× ROI through prescriptive, validated outcomes.

A friendly light-blue cartoon robot with a round head and screen face showing glowing green eyes stands upright, featuring a chest circuit-board icon above the Infinite Uptime infinity logo
FAQ – People Also Ask About Industrial Energy Optimisation
Before equipment fails, energy consumption often rises as machines work harder to maintain output. Motors draw more power, pumps and fans operate outside efficient ranges, and processes require additional energy to stay stable. These changes typically appear weeks or months before downtime, making energy behavior one of the earliest indicators of reliability loss.
Traditional dashboards provide visibility but not direction. They show abnormal energy usage without explaining why it is happening or what action should be taken. Without clear guidance, teams delay decisions, minor issues escalate, and downtime occurs despite having data available.
Prescriptive AI goes beyond alerts and predictions by recommending specific, prioritized actions. It tells teams what to fix, when to act, and why it matters—helping operators intervene early, reduce uncertainty, and prevent small inefficiencies from turning into major failures.
When energy efficiency is managed alongside equipment and process behavior, it helps stabilize operations. Stable machines consume less energy, experience fewer failures, and deliver consistent output. This directly reduces downtime while lowering energy cost per unit.
Plants typically experience fewer unplanned stoppages, lower energy intensity per unit produced, improved production consistency, and stronger margin protection. Over time, even small improvements in energy behavior can deliver meaningful EBITDA gains.