Online Asset Monitoring: The Definitive Guide to Turning Equipment Data into Verified Production Outcomes
Read Time: 8–9 minutes | Author – Kalyan Meduri

What is Asset Monitoring?
Asset monitoring is the continuous monitoring of industrial assets to ensure reliable operation, maximize equipment performance, and prevent unexpected failures.
What Is Online Asset Monitoring?
Online asset monitoring is the continuous, automated measurement of industrial equipment health using permanently installed sensors combined with advanced AI systems. Unlike traditional offline inspections, which depend on periodic manual readings, online monitoring creates a real-time, always-on view of asset behavior. It continuously captures vibration, temperature, and process data, transforming this information through Prescriptive AI into actionable recommendations rather than passive alerts. The objective is not just to observe equipment but to actively guide decisions that improve reliability and performance.
Most industrial plants today have sensors streaming data 24/7. Vibration readings, thermal profiles, and motor current dashboards glow with it all. Yet breakdowns still happen, and unplanned downtime continues to cost billions. The reason is simple: data alone does not fix machines action does. The shift now underway in manufacturing is not about collecting more data, but about converting that data into clear, trusted, and timely actions. The plants leading in 2026 are not those with the most sensors, but those using AI for Outcomes to turn signals into decisions that protect production.
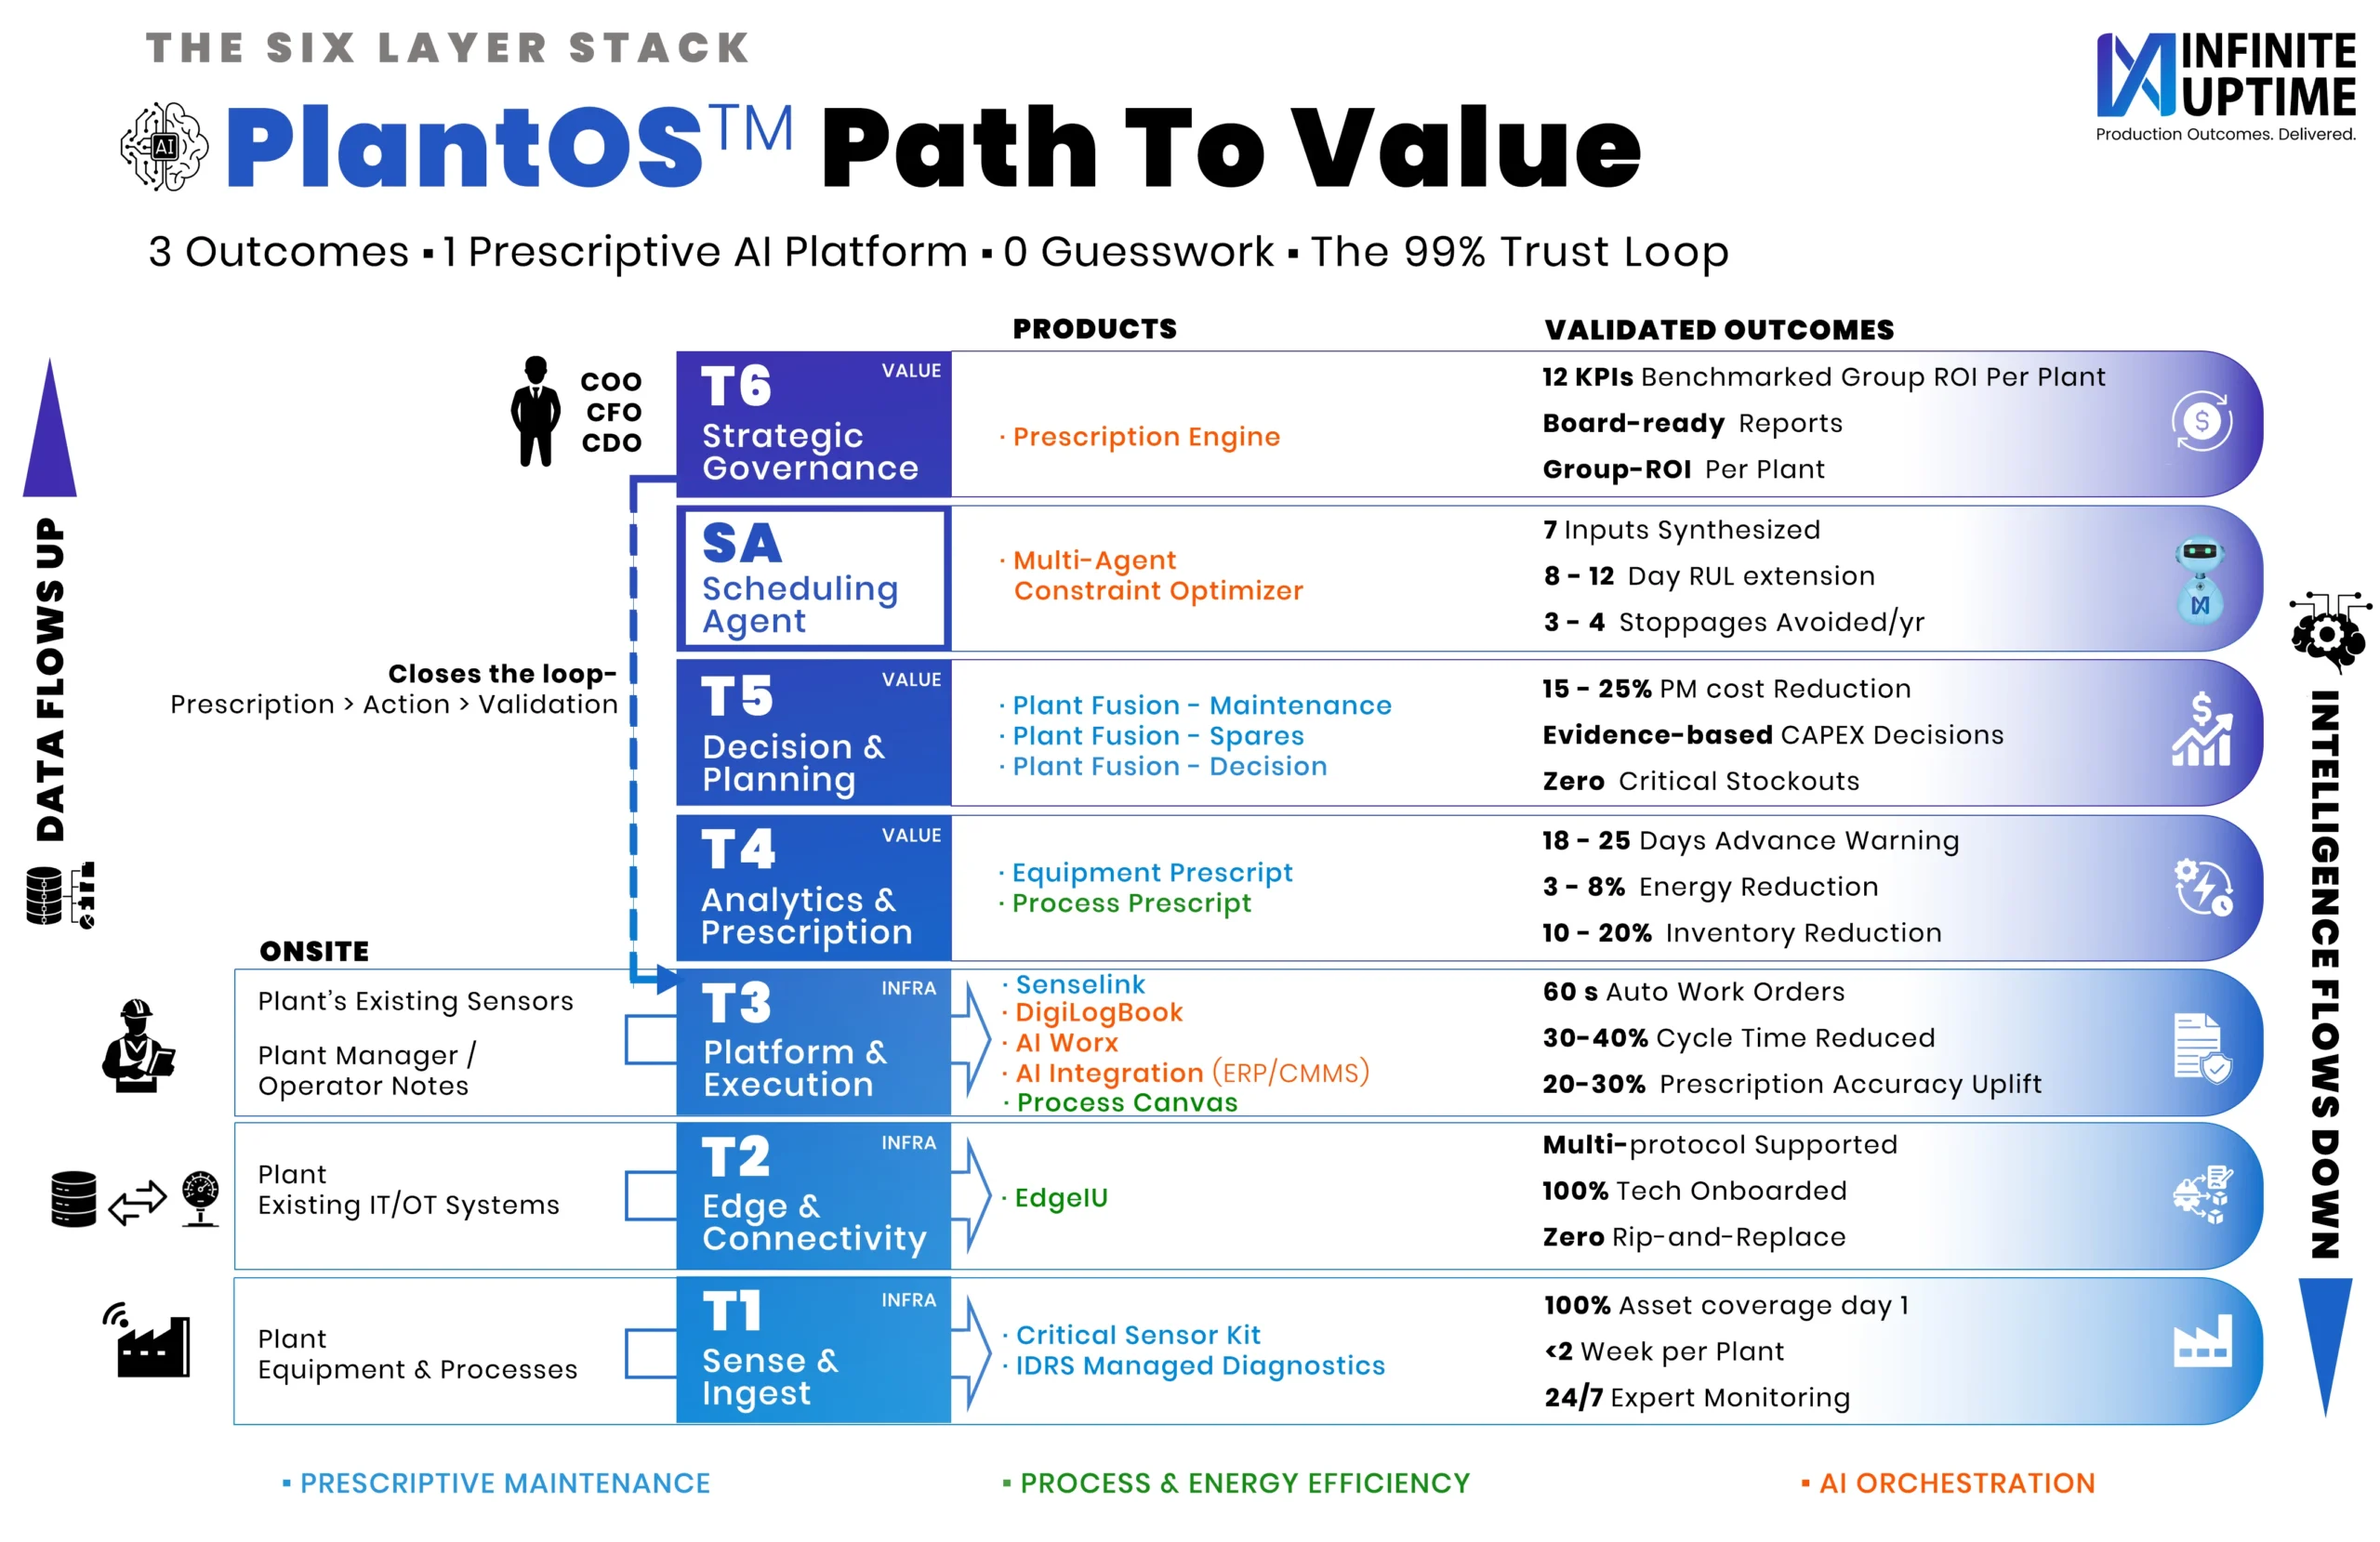
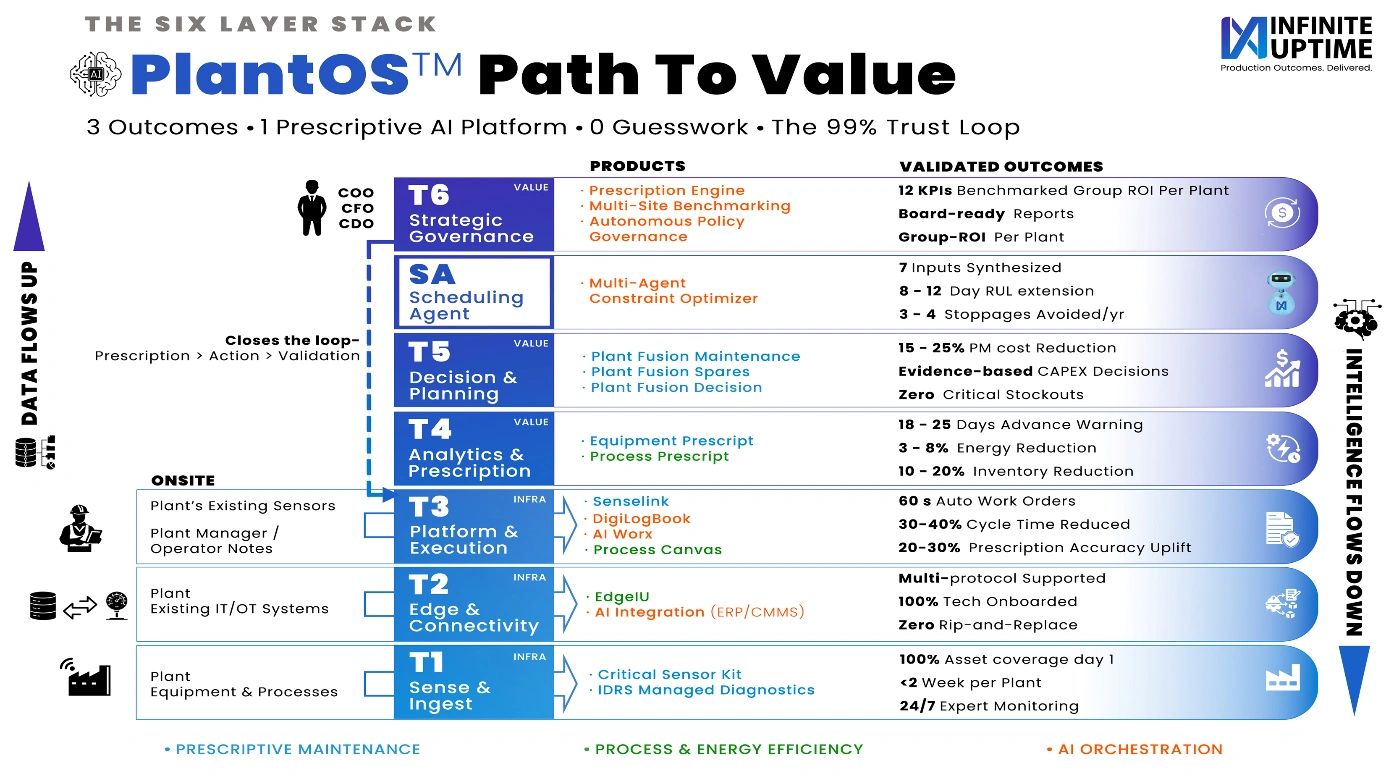
Most platforms stop at prediction. Infinite Uptime takes it further. A prediction tells you that a bearing is degrading. A prescription tells you exactly which bearing to fix, when to fix it, what to order, and what production outcome to expect if you delay. This is the difference between insight and impact. Infinite Uptime operates as a Production Outcomes Partner for Heavy Industries, delivering measurable business results through PlantOS™ a Vertical AI for Outcomes platform. With deployments across 946 plant sites in 26 countries, PlantOS™ has delivered over 42,000 validated prescriptions, helping avoid more than 36,000 breakdowns and eliminate over 157,115 hours of downtime. These are not projections they are operator-validated outcomes.
What Online Asset Monitoring Means in Heavy Industry
In heavy industries such as steel, cement, mining, chemicals, and manufacturing, online asset monitoring goes beyond condition tracking. It becomes a core layer of operational intelligence that directly influences production outcomes. A modern system integrates multiple components into a unified framework. It begins with multi-modal sensors that capture high-frequency vibration, temperature, oil condition, and electrical signals. These are supported by edge intelligence devices that preprocess data at the source. The information then flows into integrated platforms that connect with existing systems such as SCADA, DCS, ERP, and CMMS, creating a unified operational view.
At the analytics layer, AI models trained on industry-specific failure modes detect anomalies and estimate remaining useful life. However, the most critical layer is the prescriptive layer. This is where Prescriptive AI transforms detection into action, delivering ranked recommendations that operators can execute with confidence. When powered by Vertical AI for Outcomes, this architecture enables plants to move from monitoring assets to actively managing production performance.
Is asset monitoring the same as equipment monitoring?
No, they are not the same. Equipment monitoring tracks the condition of individual machines, whereas asset monitoring encompasses all critical plant assets to improve reliability, performance, and operational efficiency.
Online vs. Offline Asset Monitoring: The Critical Differences
Offline monitoring relies on periodic inspection routes, where technicians collect data manually using handheld devices. These inspections may occur monthly or quarterly, leaving significant gaps where failures can develop undetected. The quality of analysis depends heavily on individual expertise, and decisions are often delayed.
Online monitoring eliminates these limitations by providing continuous, real-time visibility into asset health. Data is collected automatically, analyzed using AI models, and translated into actionable insights. Detection windows shrink from weeks to seconds. Diagnostic depth improves through multi-signal analysis rather than subjective interpretation. Most importantly, action shifts from reactive to proactive, with prescriptive recommendations replacing basic alerts. The result is a system that not only observes but actively contributes to operational performance.
| Capability | Offline Asset Monitoring (Route-Based) |
Online Asset Monitoring (Continuous) |
| Data Collection | Periodic, manual inspection routes | 24/7 automated sensor ingestion |
| Failure Detection Window | Days or weeks between readings | Real-time anomaly detection |
| Diagnostic Depth | Analyst-dependent interpretation | AI-driven, vertical-trained fault classification |
| Work Order Integration | Manual creation and scheduling | Automated CMMS/ERP integration |
| Data Storage | Local files, spreadsheets, physical memory | Secure, encrypted cloud architecture |
| Low-Speed Asset Coverage | Often impossible below 100 RPM | Continuous monitoring from 2 RPM to 3,900 RPM |
| Action Output | Alert or trend report | Prescriptive recommendation with ranked priority |
| Outcome Tracking | Manual follow-up, limited traceability | Automated validation loop with audit-ready logs |
Why Prediction Alone Is No Longer Enough
Most asset monitoring platforms today stop at prediction. They identify anomalies and generate alerts, but leave the interpretation and decision-making to plant teams. This creates a significant execution gap. Alerts without context lead to alarm fatigue. Trends without prioritization overwhelm teams already managing complex operations.
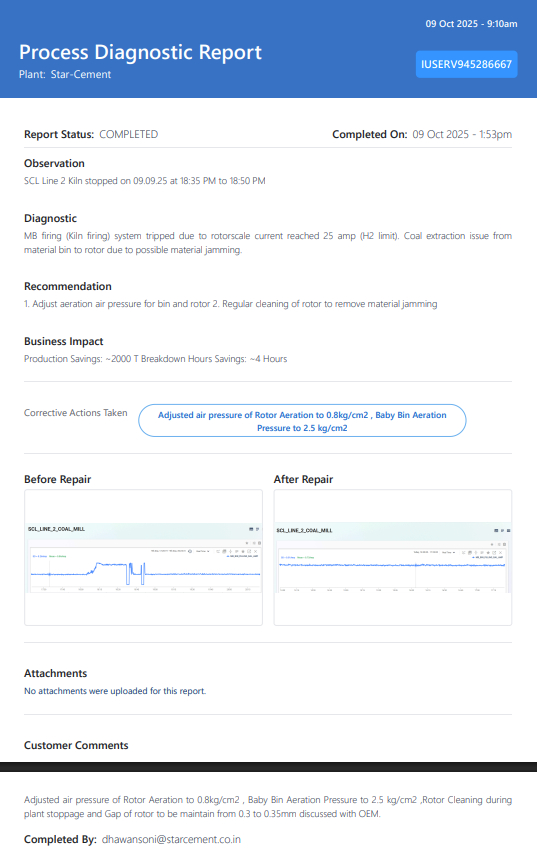
To deliver real value, monitoring must evolve into decision support. It must answer not just what is happening, but why it matters and what should be done next. This is the role of Prescriptive AI. By correlating mechanical signals with process parameters such as pressure, temperature, throughput, and energy consumption, PlantOS™ creates context-aware insights. It identifies not only the presence of a fault, but its root cause and its impact on production. This transformation from prediction to prescription is what defines a true Vertical AI for Outcomes system.
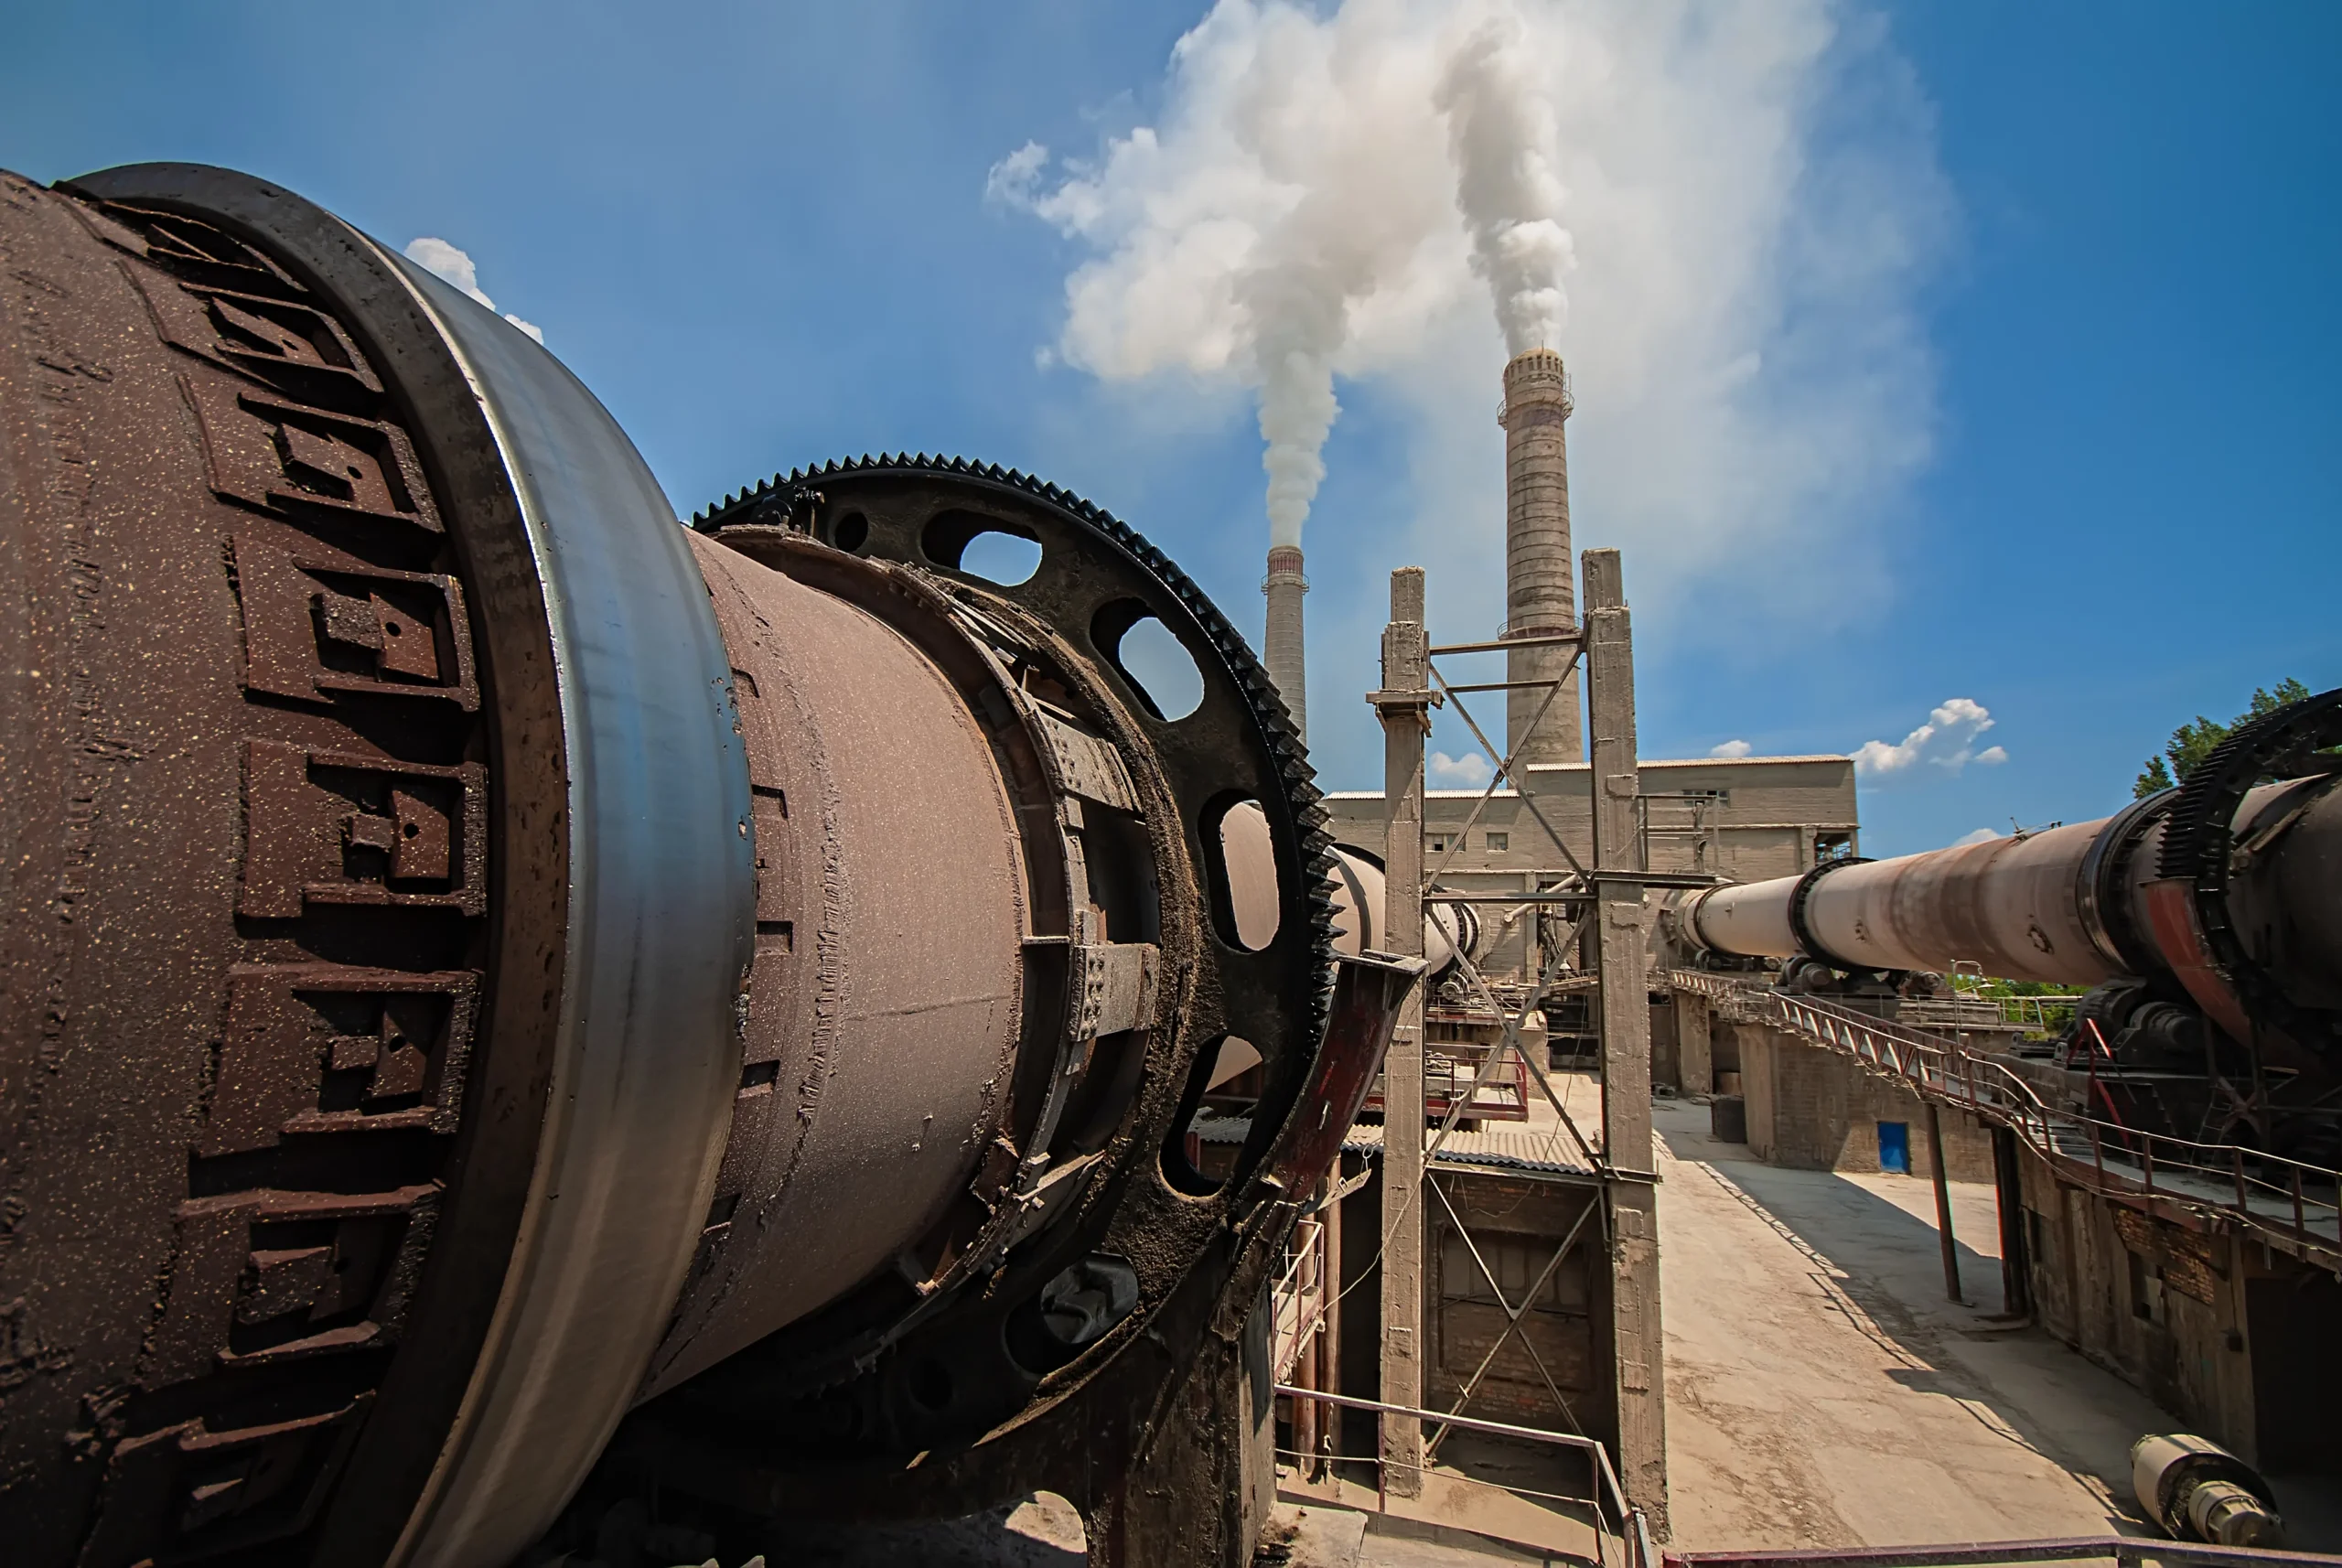
Industrial assets typically fail from two interconnected directions: equipment-borne faults and process-induced faults. Most platforms monitor only one of these domains. PlantOS™ monitors both simultaneously, because the interaction between them is where the most critical failures originate. For example, a rise in kiln drive current may not be an electrical issue it may indicate refractory degradation weeks before visible damage occurs. Only multi-domain intelligence can identify such patterns early.
Advantages of Outcome-Driven Online Asset Monitoring

Online asset monitoring delivers tangible benefits when it is outcome-driven rather than data-driven. Continuous visibility into asset health allows maintenance teams to detect early-stage faults such as bearing wear, misalignment, and lubrication issues before they escalate. This enables interventions during planned shutdowns, preventing costly secondary damage and extending equipment life.
The financial impact is significant. By reducing reliance on reactive maintenance, plants can achieve substantial reductions in maintenance costs, energy consumption, and unplanned downtime. These improvements translate directly into increased utilization and better asset performance. What differentiates Infinite Uptime is that these outcomes are validated by operators, ensuring that improvements are measurable and real.
Reliability also becomes quantifiable. By continuously tracking operating conditions, degradation trends, and failure history, plants gain accurate measures of performance such as MTBF and OEE. Multi-signal correlation improves predictive accuracy, enabling better planning and reduced uncertainty.
Integration with maintenance workflows further enhances efficiency. Automated work orders, real-time alerts with prescribed actions, and seamless integration with CMMS systems ensure that decisions are executed quickly. This reduces administrative delays and ensures that maintenance activities are aligned with operational priorities.
Finally, the ability to correlate equipment health with process performance creates a unified view of operations. Instead of isolated diagnostics, plants gain insight into how mechanical behavior interacts with process variables and energy consumption. This holistic understanding is essential for heavy industries, where small inefficiencies can accumulate into significant losses.
Did You Know?
Modern manufacturing plants generate millions of equipment data points every day, but the true value comes from converting those signals into actionable recommendations that prevent failures and improve production outcomes.
Which Equipment Should Be Monitored Online?
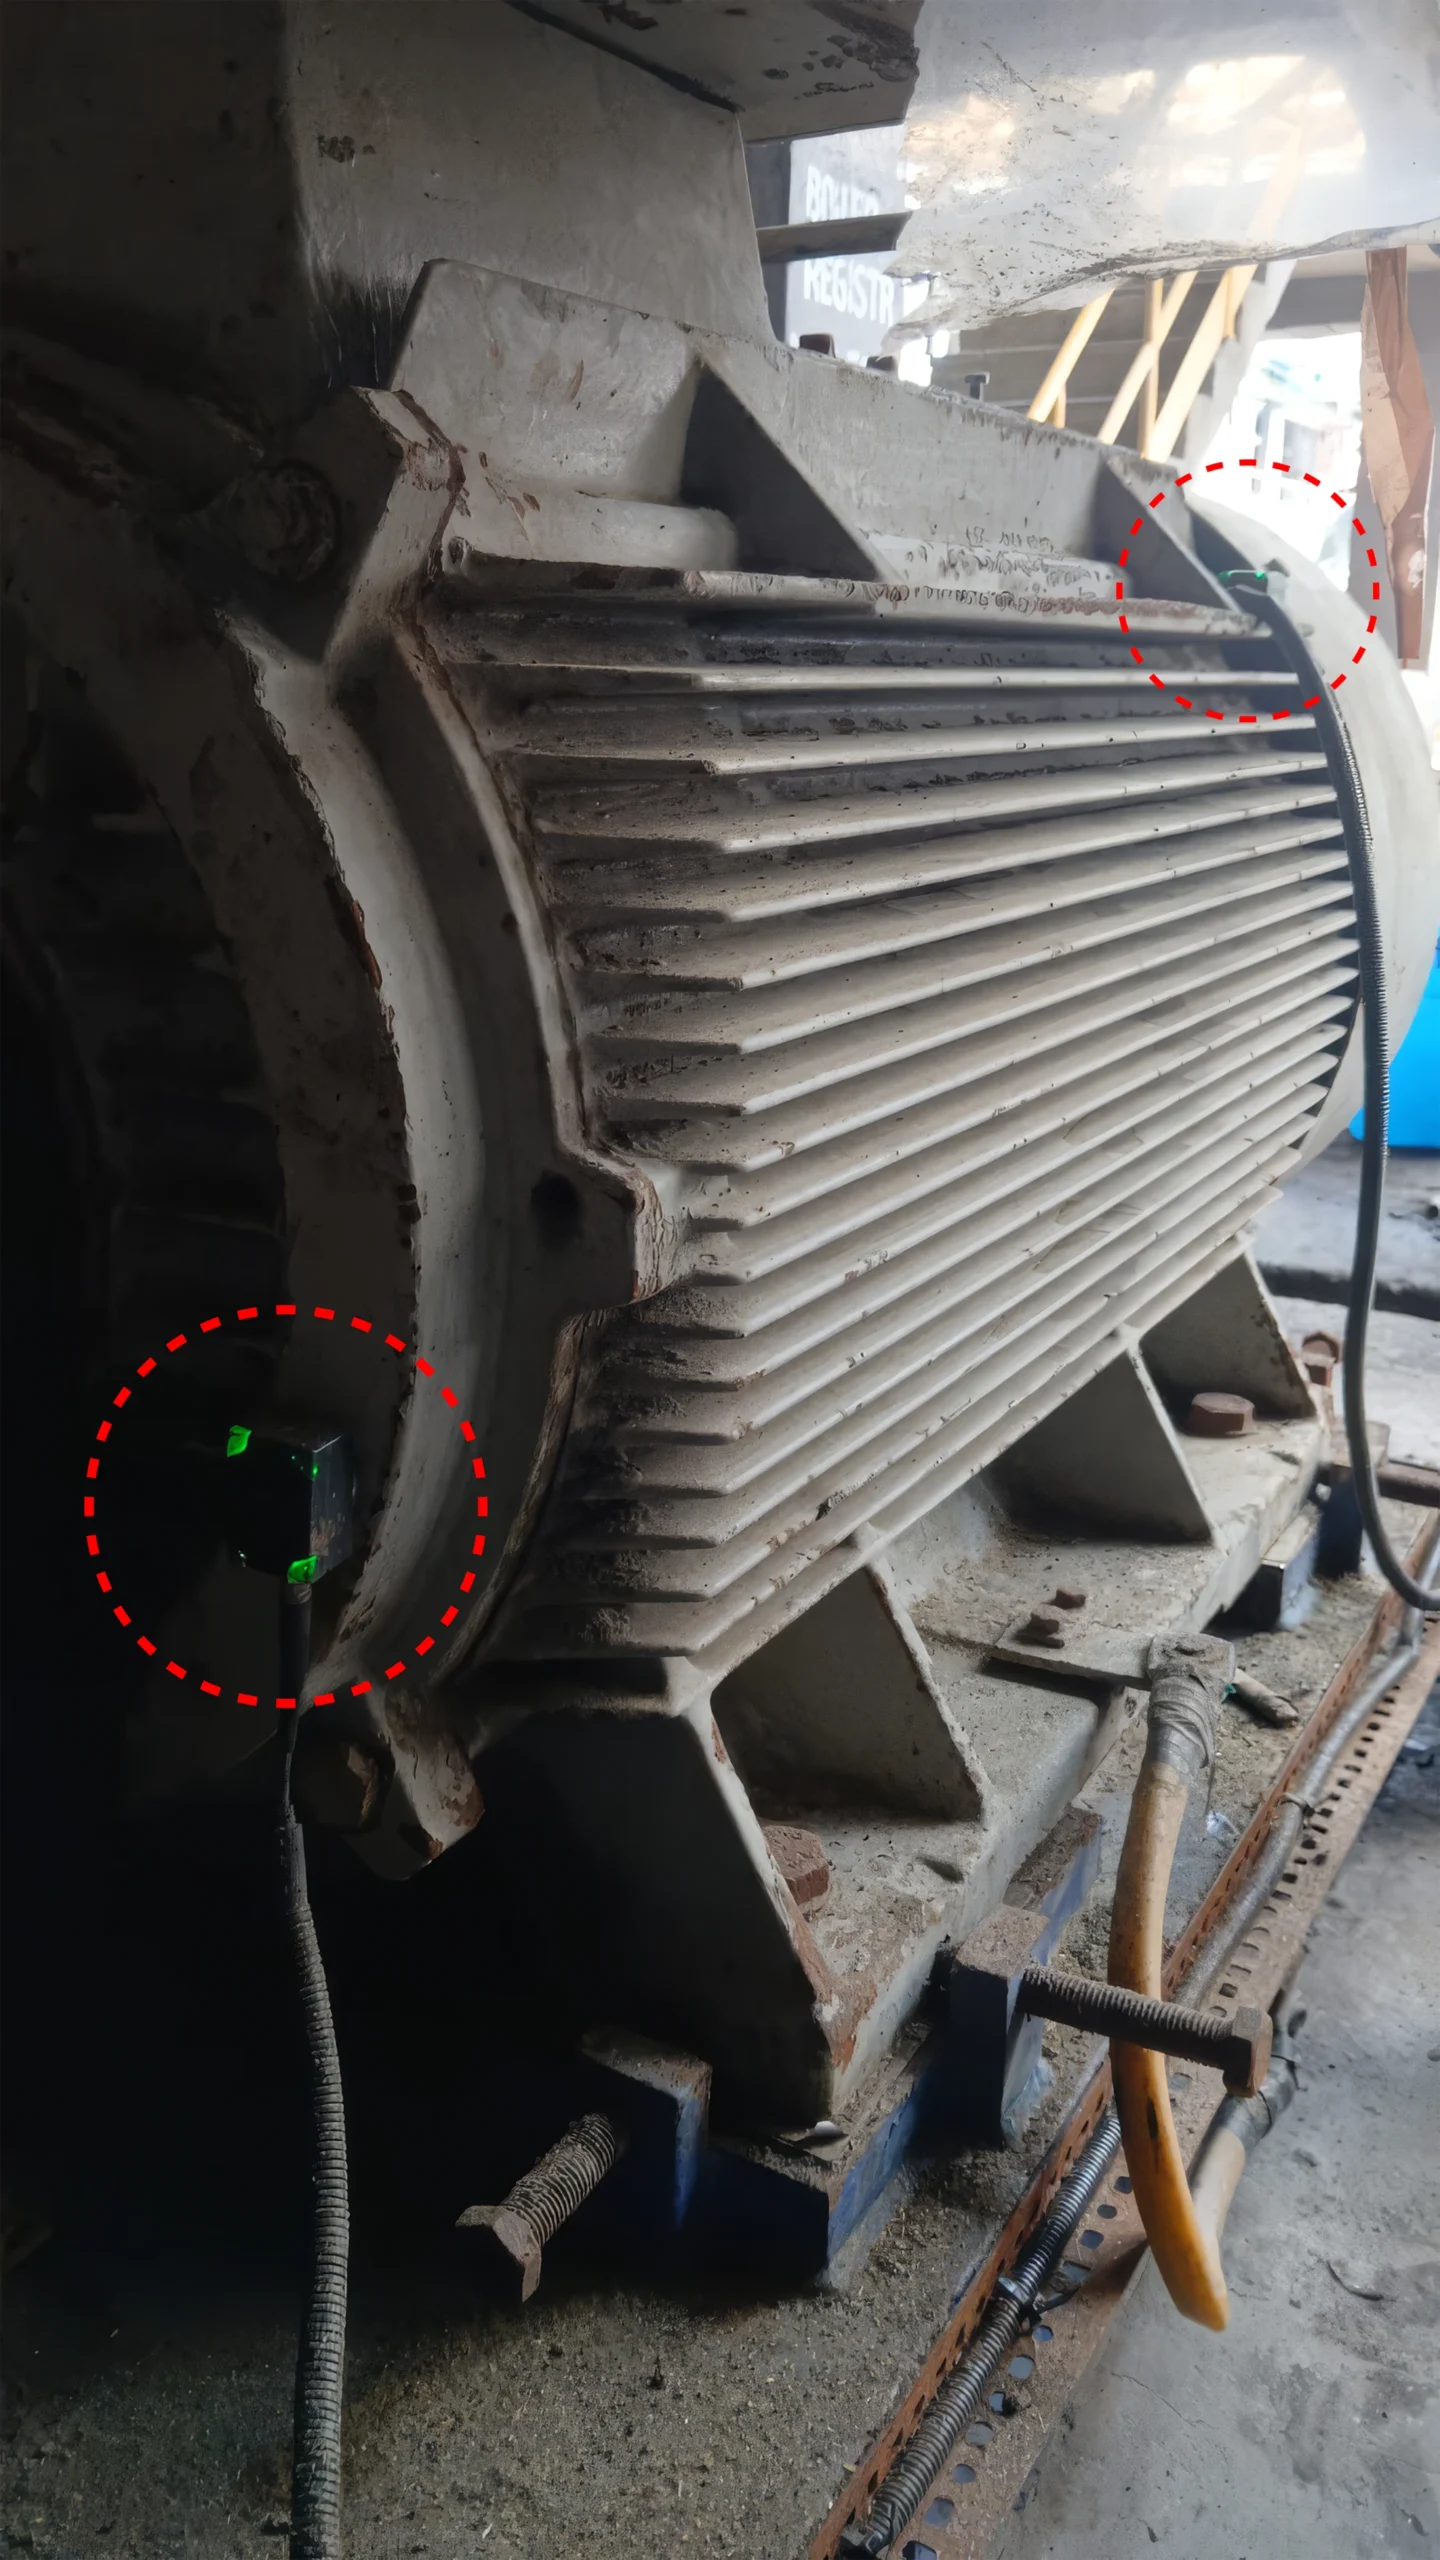
Not all equipment requires the same level of monitoring. Criticality analysis helps prioritize deployment. Critical assets that directly impact production or safety require continuous, multi-modal monitoring. Moderate-impact assets benefit from automated alerts, while low-impact assets may rely on periodic inspection.
Special attention is required for low-speed equipment and harsh operating environments. Traditional monitoring systems often fail in such conditions, missing early defect signatures. PlantOS™ addresses this challenge through advanced sensing technologies combined with Prescriptive AI, ensuring comprehensive coverage across asset types.
Technology Stack Behind Modern Monitoring
A robust online monitoring system requires a full-stack architecture. At the sensing layer, specialized sensors operate across diverse environments, including extreme temperatures and hazardous zones. The data and AI layer includes secure cloud infrastructure, vertical-trained models, and advanced simulation capabilities that interpret complex industrial behavior.
A critical differentiator is the human validation layer. AI-generated prescriptions are reviewed by domain experts, creating a trust loop that ensures accuracy and continuous improvement. This hybrid approach combines machine intelligence with human expertise, ensuring reliability in real-world conditions.
At the delivery layer, insights are integrated into operational systems through APIs, dashboards, and automated workflows. Every prescription is tracked to its outcome, creating a closed-loop system where Prescriptive AI directly drives measurable results.
Online Asset Monitoring Across Industries
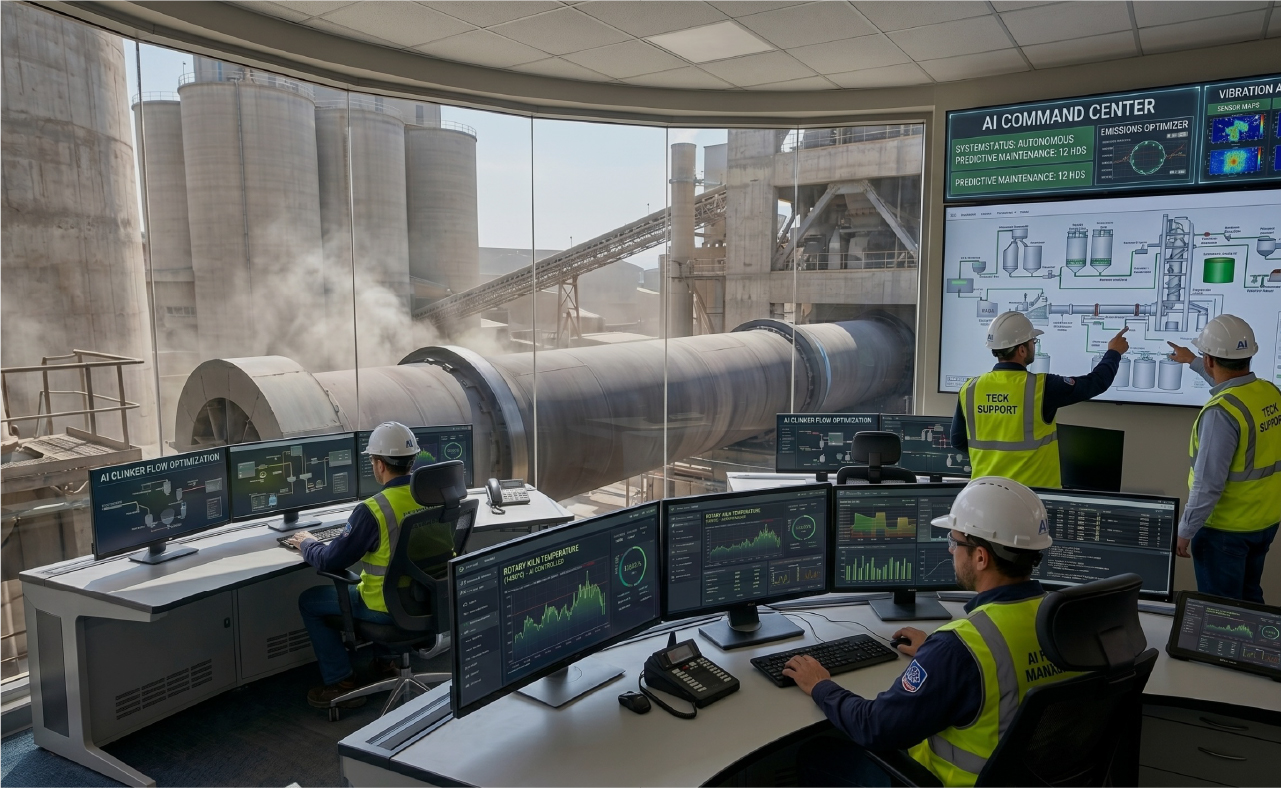
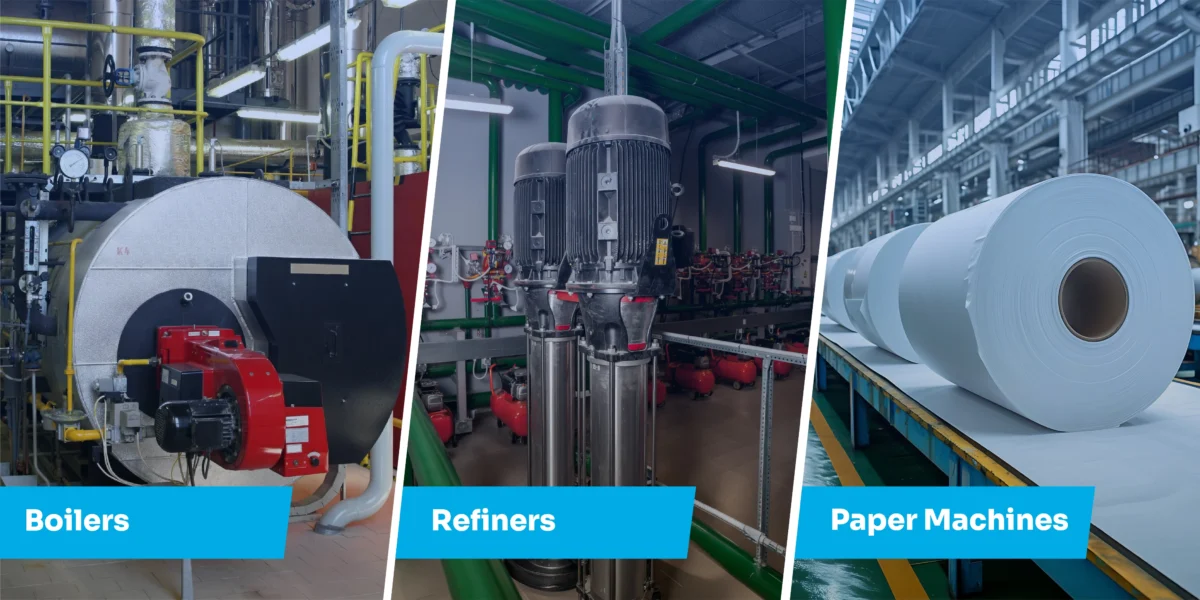
Industrial challenges are not uniform, and monitoring systems must reflect this reality. PlantOS™ applies Vertical AI for Outcomes across multiple sectors, adapting to industry-specific conditions. In steel plants, it correlates thermal and mechanical stresses to prevent critical failures. In cement, it identifies process drift that impacts energy efficiency. In mining, it enables remote monitoring of distributed assets. In food and beverage, it supports low-speed hygiene-critical equipment. In chemicals and pharmaceuticals, it ensures batch consistency and regulatory compliance.
Across all industries, the objective is consistent: convert data into decisions that improve production outcomes.
Conclusion
Online asset monitoring is now a standard capability in modern manufacturing. The real differentiator lies in how effectively data is converted into action. Systems that stop at alerts create noise. Systems that deliver prescriptions create results.
Infinite Uptime is redefining this space as a Production Outcomes Partner for Heavy Industries, using PlantOS™ a Vertical AI for Outcomes platform powered by Prescriptive AI to bridge the gap between detection and execution. By transforming raw data into operator-validated actions, PlantOS™ enables plants to achieve lower costs, higher throughput, and improved reliability.
The future of industrial operations lies not in monitoring more, but in acting better. From data to decisions, from insights to outcomes this is the evolution that will define the next era of manufacturing.
Asset Condition Monitoring, IoT Asset Monitoring, and Asset Health Monitoring: Are They the Same Thing?
These four terms overlap heavily, but each carries a slightly different emphasis.
Term |
What It Means |
|---|---|
| Asset Condition Monitoring | Refers to the practice of tracking specific condition indicators such as vibration, temperature, and oil quality on a piece of equipment. Online asset monitoring is asset condition monitoring performed continuously rather than periodically. |
| Industrial Asset Monitoring | Applies the same practice specifically within a manufacturing or heavy-industry setting, where the assets being monitored include production equipment such as kilns, cranes, mills, pumps, and motors. |
| IoT Asset Monitoring | Describes the technology layer that makes online monitoring possible at scale, using connected wired or wireless sensors to transmit data over networks such as cellular or Wi-Fi, without requiring a technician to be physically present. |
| Asset Health Monitoring | Describes the outcome of monitoring: a continuously updated view of how healthy—or how close to failure—a given asset is, usually expressed as a status, health score, or specific fault flag rather than raw sensor data. |
Ready to Move from Data to Outcomes?
If your plant is still operating on alerts, the next step is clear.
Read More on Industrial Energy Efficiency
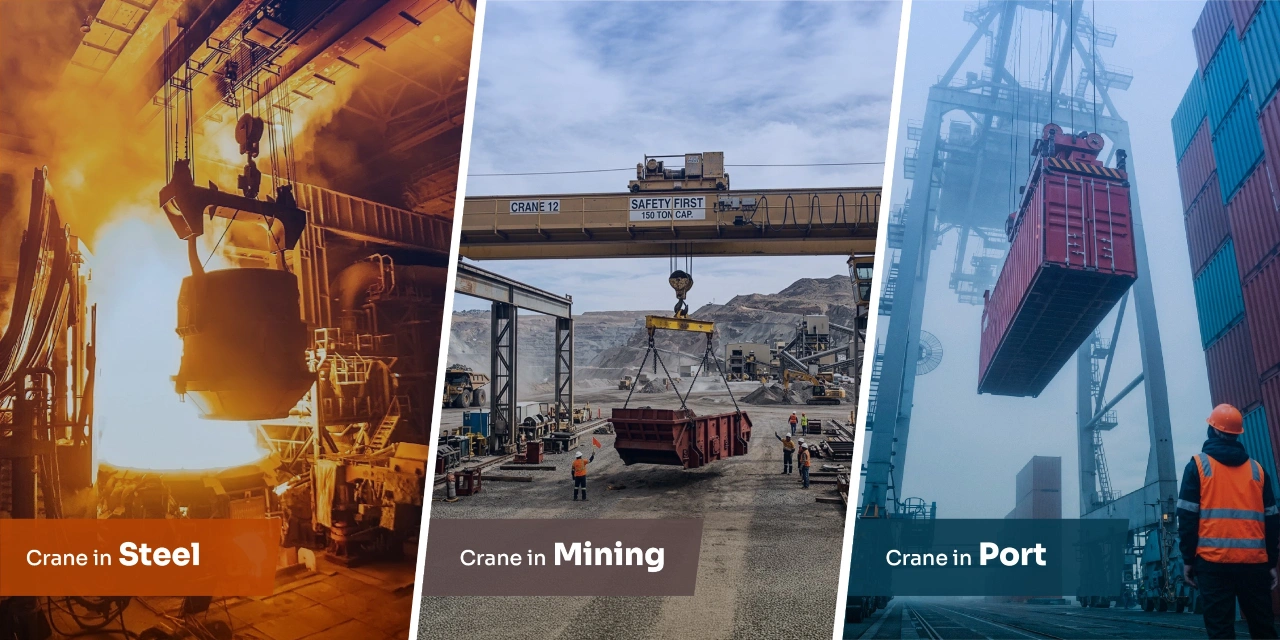
When the Crane Goes Down, Everything Stops
When the Crane Goes Down, Everything Stops. Why EOT Crane...
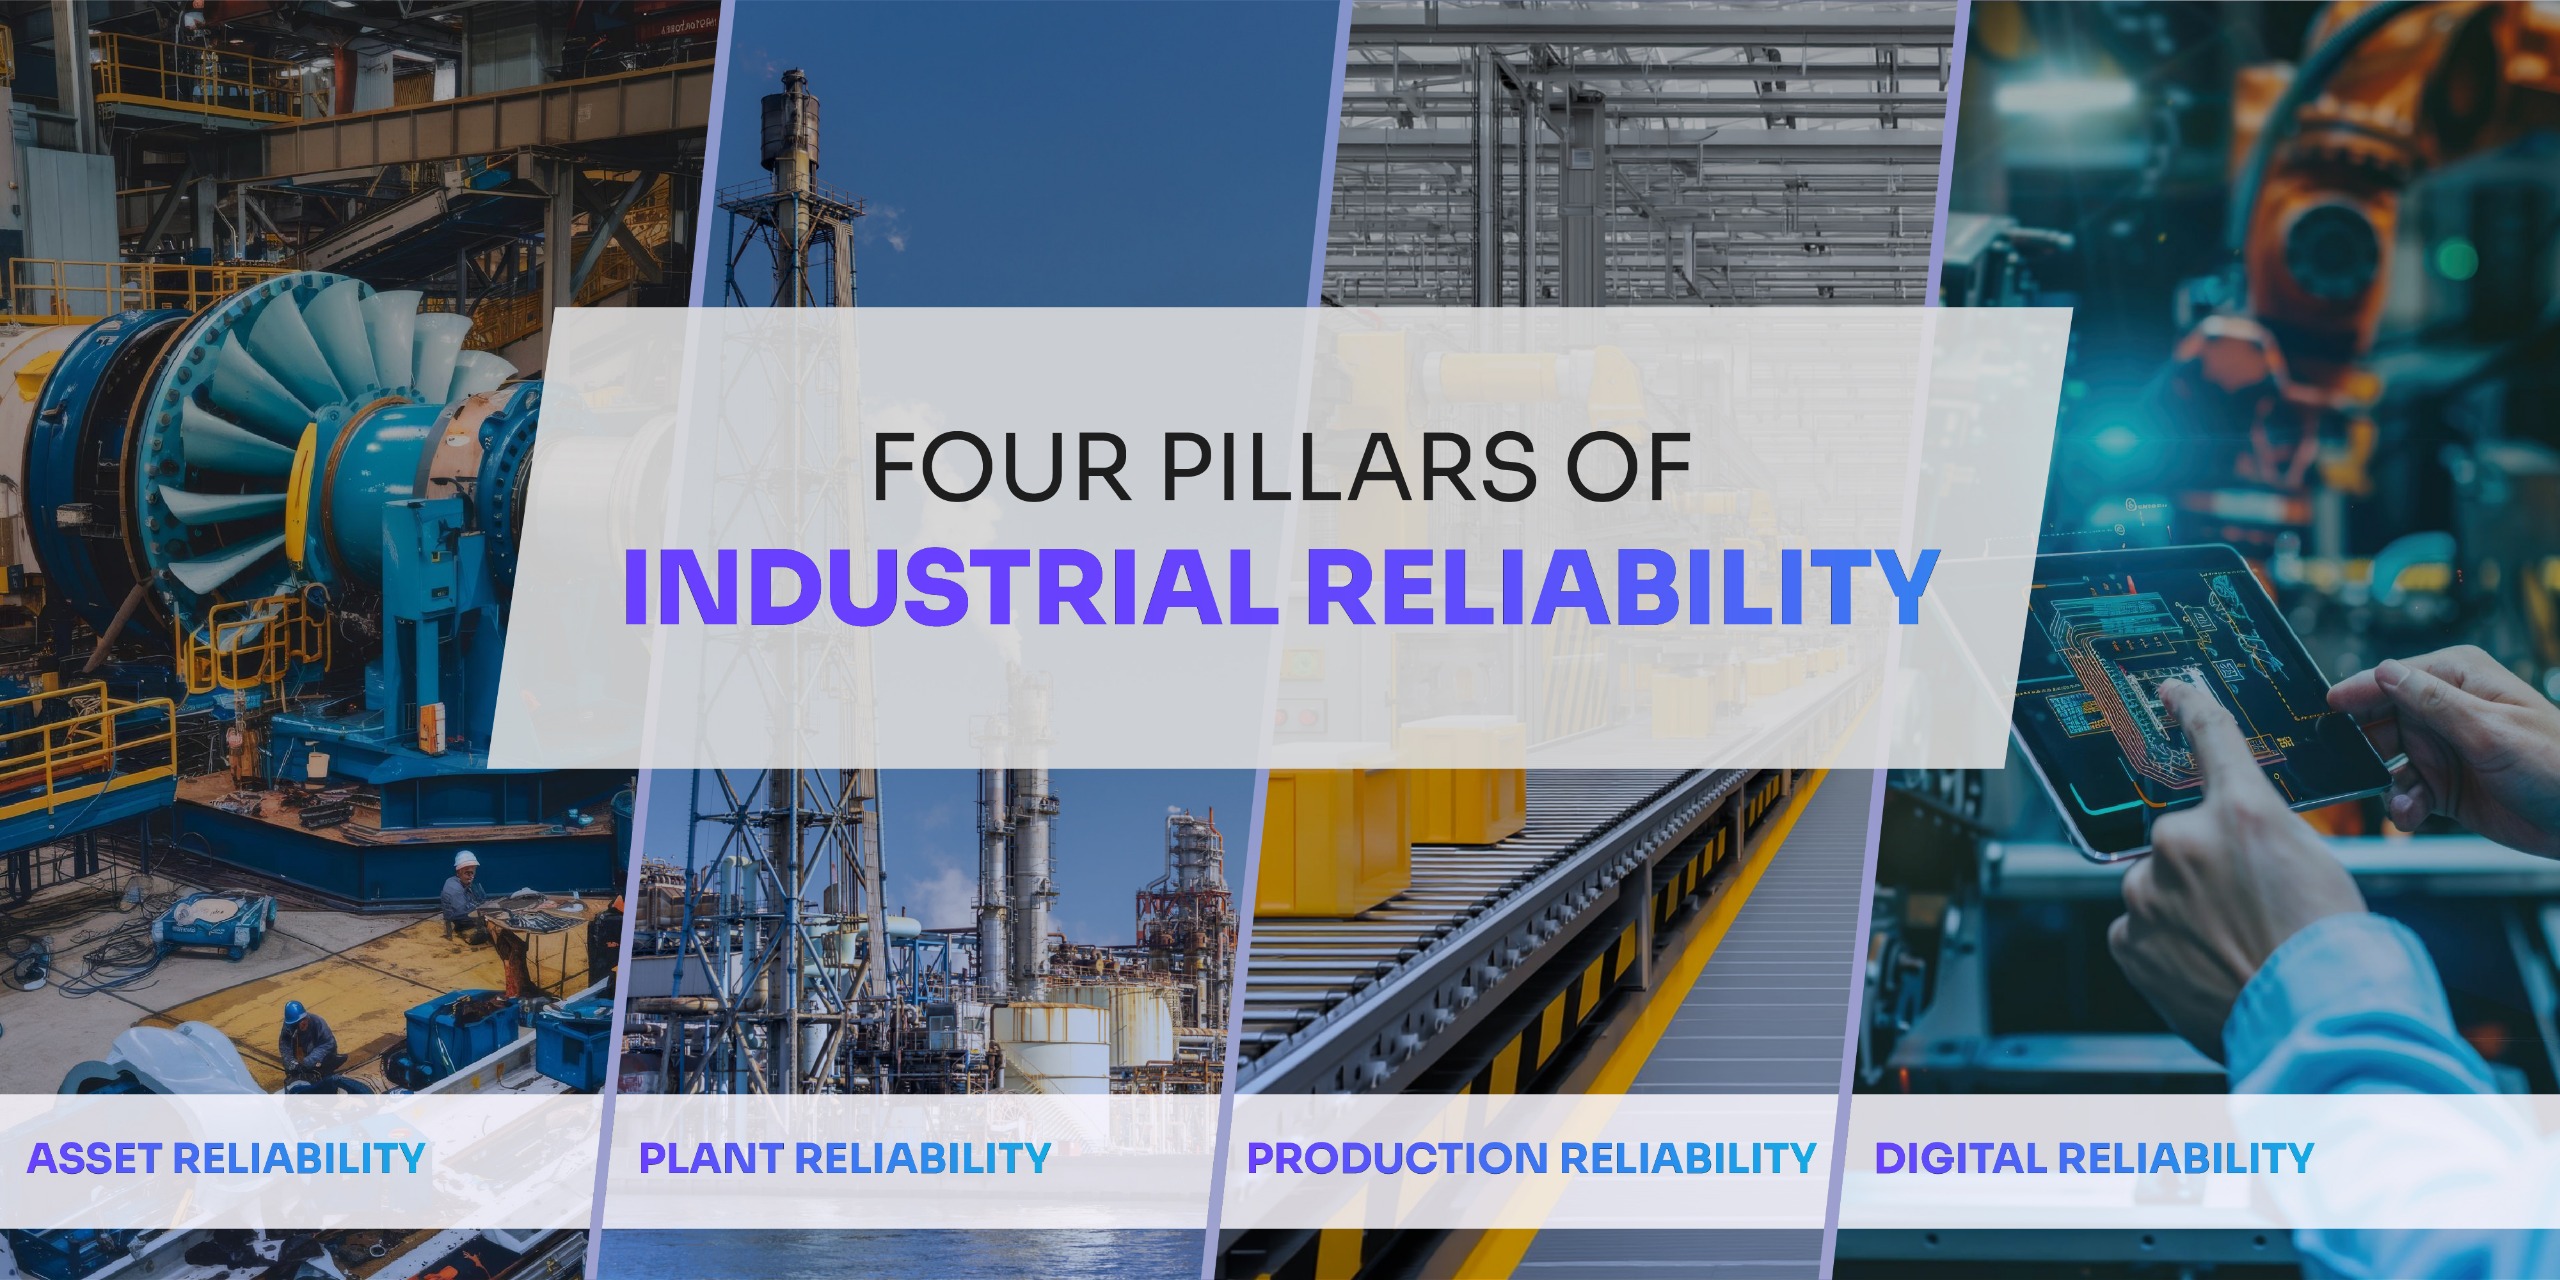
The Four Pillars of Industrial Reliability
In heavy industries today, reliability is no longer just “fewer...

Understanding Asset Optimization in Manufacturing
Mission-critical assets in manufacturing setups can make or break an...
Frequently Asked Questions
Predictive maintenance identifies potential failures. Prescriptive AI goes further by recommending specific actions, timelines, and expected outcomes, enabling faster and more accurate decisions.
Most deployments are completed within 6–8 weeks, depending on plant size and asset coverage.
Yes, PlantOS™ integrates seamlessly with existing enterprise systems to automate workflows and improve maintenance efficiency.
Plants typically see rapid ROI through reduced downtime, lower maintenance costs, and improved throughput, driven by operator-validated outcomes.