Process Anomalies to Carbon Penalties: The Hidden Energy Story Inside European Cement Plants How silent process drift inside cement plants became a priced carbon risk — and why the answer lies in the gap between what plants measure and what they miss.
Read Time: 5–6 minutes | Author – Kalyan Meduri
Europe’s cement industry is entering a new operating reality, and it has little to do with market demand or fuel prices. With EU ETS carbon prices now exceeding €80–90 per tonne of CO₂ — and the Carbon Border Adjustment Mechanism becoming financially enforceable from January 2026 — energy inefficiency has crossed a threshold. It is no longer an internal operational concern. It is a priced carbon exposure, one that now directly shapes margins, export viability, and competitive positioning.
What makes this exposure difficult to manage is not the absence of technology. Most European cement plants already run DCS systems, maintenance platforms, and periodic energy reports. The problem is where the losses actually originate.
Most excess energy and carbon emissions in cement plants do not come from failures. They do not come from downtime, broken equipment, or obvious process upsets. They come from anomalies that persist quietly while the plant appears stable — gradual drifts in process behaviour that inflate specific energy consumption week over week, with no alarm, no throughput loss, and no visible signal until the carbon cost is already locked in.
The Carbon Arithmetic of Cement Production
Cement manufacturing accounts for roughly 6–8% of global CO₂ emissions — approximately 2.4 gigatonnes annually. The sources are well understood: chemical emissions from limestone calcination, and the energy intensity of thermal and grinding operations. In a typical integrated plant, thermal energy to the kiln and calciner accounts for 60–65% of total consumption; electrical energy for grinding, fans, and utilities makes up the remaining 35–40%.
The regulatory implication of this split is direct: any process deviation that increases GJ per tonne of clinker or kWh per tonne of cement also increases Scope 1 or Scope 2 emissions — even when throughput remains unchanged. There is no operational buffer between process inefficiency and carbon liability.
The EU BAT benchmark for a modern precalciner kiln sits at 3.0–3.2 GJ per tonne of clinker. A deviation of just 0.1 GJ per tonne on a one-million-tonne-per-annum clinker line translates to more than 100,000 GJ of excess energy annually and 7–9 kilotonnes of additional CO₂. At current EU ETS prices, that is a seven-figure carbon cost from a deviation that registers nowhere in standard KPI dashboards.
Where Energy Quietly Escapes
Kilns and Calciners: Burning Fuel Without a Warning
Kiln instability is among the least visible sources of thermal energy waste. False air ingress, cyclone pressure imbalance, alternative fuel calorific variability, and raw meal chemistry swings — particularly in lime saturation factor and silica modulus — can push specific heat consumption from the BAT benchmark of around 680 kcal per kilogram of clinker to 750 kcal or beyond. That is approximately 10% higher fuel consumption, with no production alarm and no throughput signal. By the time monthly energy reports capture the drift, the EU ETS liability has already accrued.
Vertical Roller Mills: Sensitivity That Operates at Scale
A well-operated VRM grinding circuit consumes 20–23 kWh per tonne of cement. Under unstable conditions — grinding bed instability, separator cut-size drift, excess circulating load — that figure climbs to 25–30 kWh per tonne. For a one-million-tonne-per-annum cement mill, a sustained drift of just three kWh per tonne represents 3 GWh of excess electrical consumption annually: roughly 1.2–1.5 kilotonnes of additional CO₂ at EU grid intensities. The process does not stop. Output continues. The energy inflation simply does not appear until the bill arrives.
Ball Mills: The Most Misleading Energy Risk
Ball mills represent a particular blind spot in legacy plants. Unlike VRMs, their inefficiency is structurally hidden. Sub-optimal grinding media charge, incorrect separator settings, high recirculation ratios, worn liners causing slip rather than breakage, and pinion-girth gear misalignment can collectively drive mill power consumption 15–20% above optimal — with no noticeable throughput loss and no immediate alarm. Specific energy typically ranges from 35–42 kWh per tonne under normal conditions. Under silent drift, that ceiling is regularly exceeded. KPIs appear normal. The plant appears stable. Scope 2 emissions quietly increase.
Fans: Silent Multipliers Across the Plant
Fans consume 20–30% of a cement plant’s total electrical load. Fouling, duct build-up, or mechanical imbalance can increase fan power draw by 10–15%. These losses almost never affect availability or throughput — they affect only energy intensity, and they accumulate invisibly across shift reports and monthly aggregations.
CBAM Changes the Penalty Structure
What CBAM introduces — beyond the carbon price itself — is a fundamentally different penalty logic. Under the previous operating model, carbon costs were partially absorbed, partially passed through, and managed as a macro-level cost line. CBAM changes this: from January 2026, cement and clinker imports face EU ETS-linked pricing based on embedded emissions, calculated at the level of the production process.
The implication is precise and consequential. CBAM does not penalise geography or fuel choice alone. It penalises process inefficiency. A plant running at 750 kcal per kilogram of clinker rather than 680 carries a structurally higher embedded emissions figure — and a structurally higher CBAM liability — regardless of where it is located or what fuel it burns.
CSRD: From Reported Numbers to Demonstrated Control
The Corporate Sustainability Reporting Directive adds a further dimension that is frequently underestimated. Under CSRD, cement producers are required to disclose not only energy intensity metrics but evidence of operational controls — demonstrable governance over the accuracy and reliability of sustainability data.
Manual, monthly energy aggregation cannot satisfy this requirement. It cannot explain why grinding instability occurred over a 48-hour window, why fan load trended upward across three shifts, or how refractory heat loss in the kiln contributed to a quarterly Scope 1 increase. Process-level explainability is now a regulatory expectation, not a reporting aspiration.
The Gap That Remains — and Where It Lives
European cement plants are not operating without data. They are operating with data that does not connect.
DCS systems show what is happening in the process. Maintenance systems explain why equipment eventually fails. Energy reports show how much energy was consumed — after the fact. What none of these provide is an integrated, real-time answer to the question that now carries direct financial consequence:
Which process deviation, combined with which emerging asset condition, is inflating kWh per tonne or kcal per kilogram right now — and by how much?
This is the gap where CBAM exposure accumulates and where CSRD obligations become difficult to defend. Closing it requires something that monitoring dashboards and periodic reports were never designed to deliver: continuous correlation across process behaviour, energy intensity, and asset health — followed by a recommendation that an operator can act on, validate, and trust.
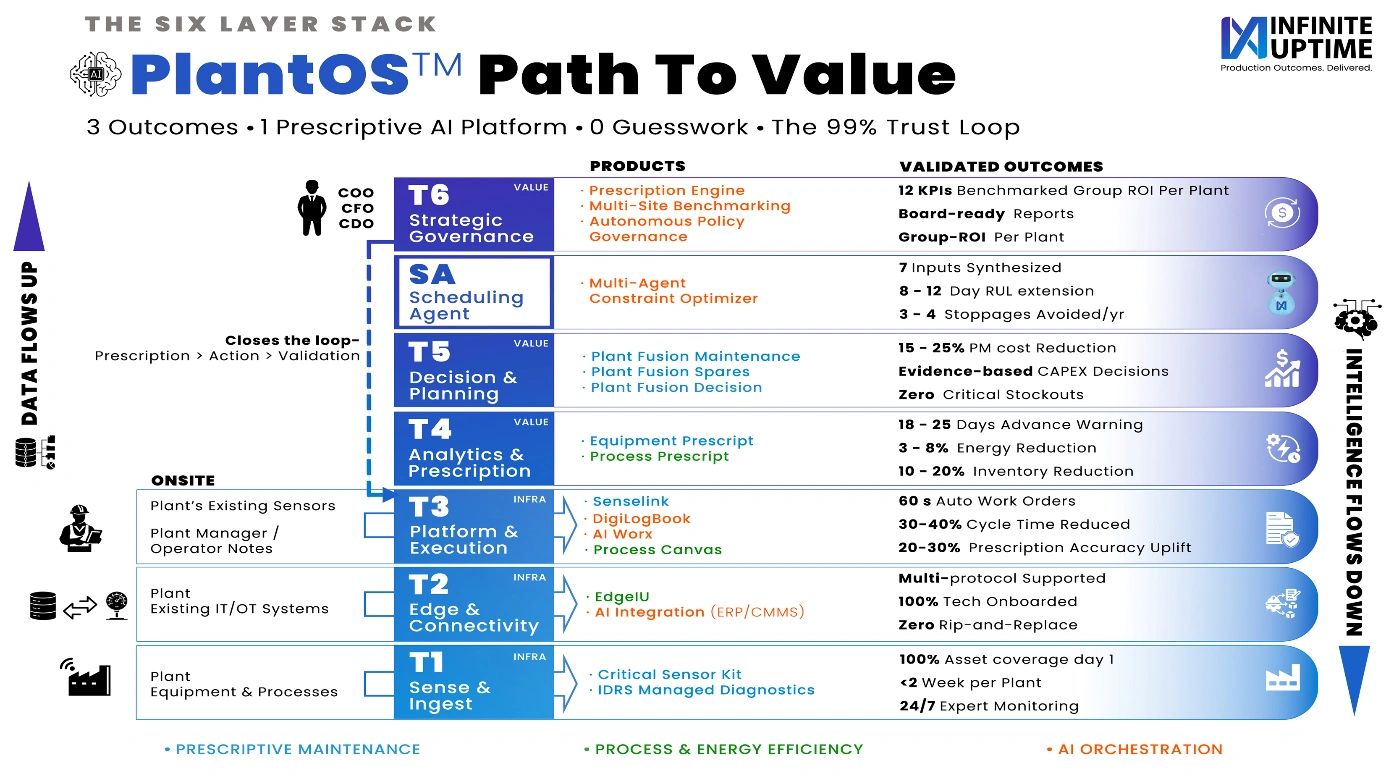
This is precisely where Infinite Uptime’s Process Business, built on PlantOS™, operates.
PlantOS™ works at the process-energy interface — where deviations are still small, corrections are still low-cost, and carbon penalties can still be avoided. It identifies VRM separator drift before a sustained energy increase hardens into a reporting obligation. It flags kiln heat imbalance while fuel efficiency is still recoverable. It surfaces chronic ball mill over-consumption that no conventional dashboard has flagged — because throughput never dropped and no alarm ever fired.
Critically, the system does not act in isolation. Every recommendation is designed to be reviewed, validated, and owned by the operator on the floor. The outcome is not automation displacing judgment — it is agentic intelligence that accelerates it. Over time, each intervention that an operator validates becomes part of a continuously improving decision fabric: a record of what worked, under which conditions, on which assets.
The following Process Diagnostic Report, drawn from live cement plant deployments, show what this looks like in practice.
In the Field: What Operator-Validated Outcomes Look Like
Star Cement — Kiln Firing System Trip, Coal Extraction Fault
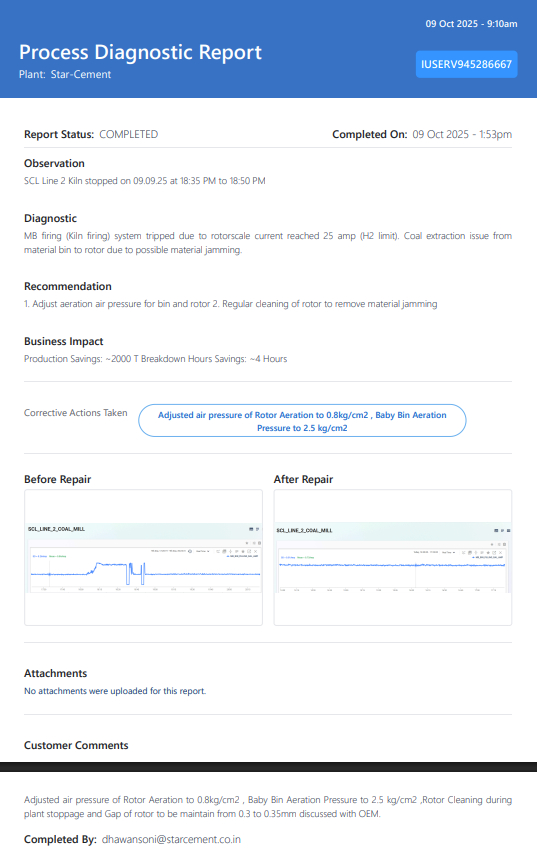
At Star Cement, SCL Line 2 Kiln stopped on 9 September at 18:35. PlantOS™ diagnosed the cause within the same operational window: the MB firing system had tripped because rotor scale current reached 25 amps — the H2 limit — due to material jamming in the coal extraction path from the bin to the rotor. The recommendation was precise: adjust aeration air pressure for the bin and rotor; implement regular rotor cleaning to prevent recurrence.
The operator validated and executed: Rotor Aeration adjusted to 0.8 kg/cm², Baby Bin Aeration set to 2.5 kg/cm², rotor gap confirmed at 0.3–0.35mm in discussion with the OEM. Customer comment logged: “Corrective action found effective.”
Business impact: approximately 2,000 tonnes of production protected, four breakdown hours saved.
This is not just a case study prepared for a presentation. This is Process Prescription Report generated by PlantOS™, acted & validated by plant operators, and time-stamped to the hour. The observation, diagnostic, recommendation, corrective action, and business impact are all in one record — auditable, explainable, and CSRD-ready.
This is what positions PlantOS™ as Industrial Agentic AI for Operator-Validated Outcomes — not a monitoring layer that surfaces data, but a decision layer that closes the loop between process intelligence, human judgment, and measurable operational impact.
In the CBAM and CSRD era, process control is carbon control. The plants that close this gap first will carry a lower embedded emissions figure, a stronger regulatory position, and a structurally more defensible cost base. The plants that do not will continue to discover the penalty after it has already been paid.
To explore what this looks like for your operations,
see here: Get in touch here .
Thank you for your interest in PlantOS™ Prescriptive AI.
Read More on Industrial Energy Efficiency
Prescriptive AI for U.S. Cement
In the United States, unplanned downtime costs manufacturers over $1...
Energy Efficiency, Innovation & Process Reliability:
Energy Efficiency, Innovation & Process Reliability: The Unseen Trio Driving...

Prescriptive Maintenance + Energy Efficiency: A Practical Path to Stable Industrial Operations
In the United States, unplanned downtime costs manufacturers over $1...