- Where the downtime hours actually go
- 1. It reads the process, so the diagnosis does not stall
- 2. It names the fault mode, so the right job gets raised
- 3. It ranks by production impact, so the critical line is defended first
- 4. It ends at a work order, so the fix actually happens
- Anatomy of a prescription
- 5. It records the outcome, so next quarter is faster than this one
- What the compression is worth
- Auditing your own downtime in one shift
In short: Detection alone does not recover downtime hours. Prescriptive AI cuts unplanned downtime by compressing the interval between a fault appearing on an asset and a corrective job being completed on the floor.
- Downtime is a delay problem, not only a detection problem. Most lost hours accumulate after the anomaly is already visible, inside diagnosis, prioritization and scheduling.
- Process data completes the diagnosis. Reading PLC and historian signals alongside vibration exposes the operating condition driving the fault, not just the symptom.
- Prioritization protects the production plan. Faults are ranked by production impact, so the critical line is defended before the standby pump is.
- The instruction reaches the person who can act. A prescription carries a named action and a deadline, and it closes with a digital signoff rather than a risk chart.
- Validated outcomes compound. Across the PlantOS™ install base, up to 99 % of prescriptions are acted upon, contributing to 167,837 hours of unplanned downtime saved.
Ask a reliability engineer why a critical asset stopped last quarter and the answer is rarely that nothing was seen. Something was seen. A vibration reading drifted, an alert was raised, a screenshot went into a WhatsApp group, and the job was scheduled for the next planned window that arrived too late.
The hours were not lost at detection. They were lost in everything that followed.
Prescriptive maintenance solutions
attack that interval directly. Here is how Prescriptive AI
converts equipment and process data into prioritized maintenance actions, and where each stage
removes downtime hours from the plant.
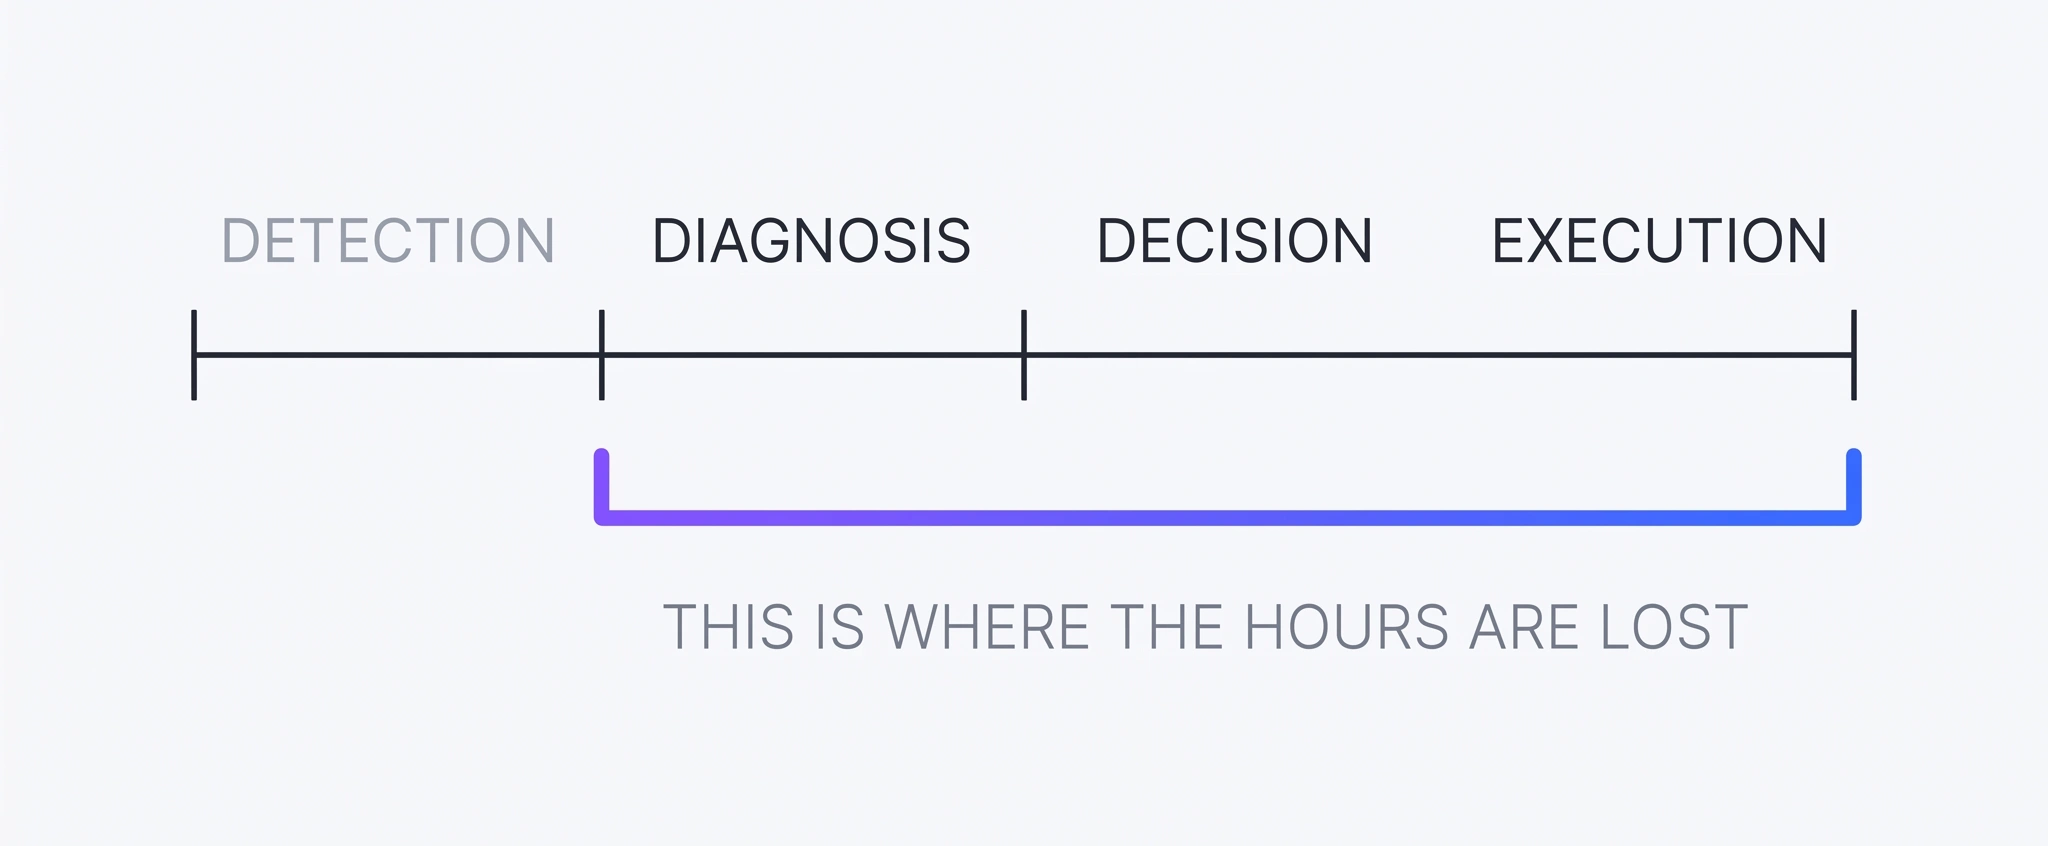
Where the downtime hours actually go
Unplanned downtime is the sum of four intervals, and only the first belongs to detection.
The detection lag is the time between degradation starting and the system noticing. Condition monitoring already handles this well. The diagnosis lag is the time between noticing and knowing what is wrong, which usually depends on one experienced engineer finding time to read a waveform. The decision lag is the time between knowing and agreeing that this job outranks the other fourteen open jobs. Finally, the execution lag covers work order creation, spares availability, and closure on the floor.
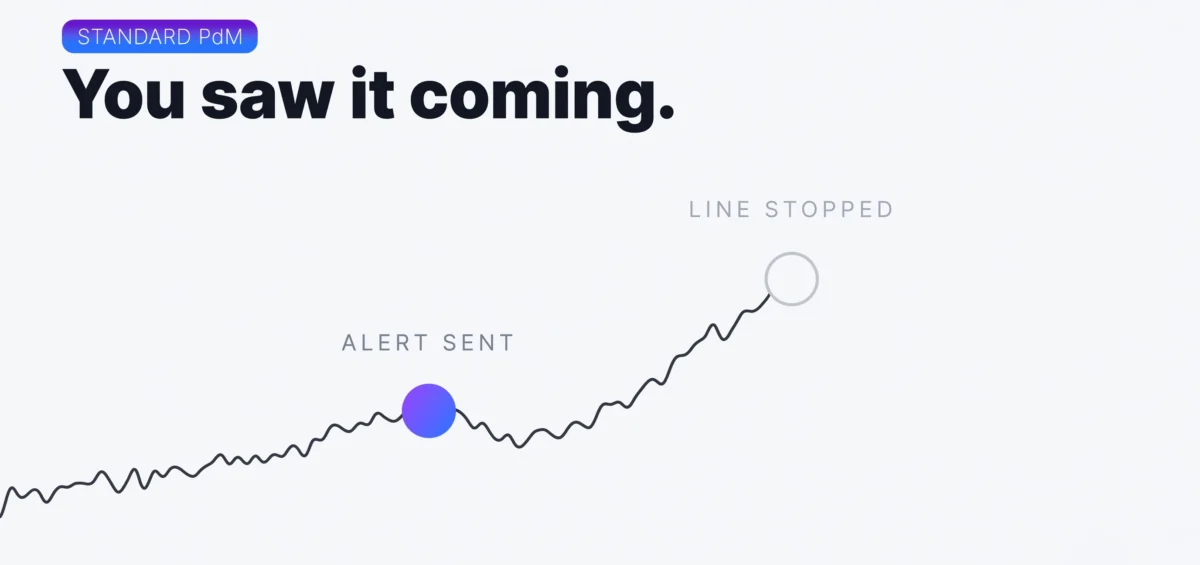
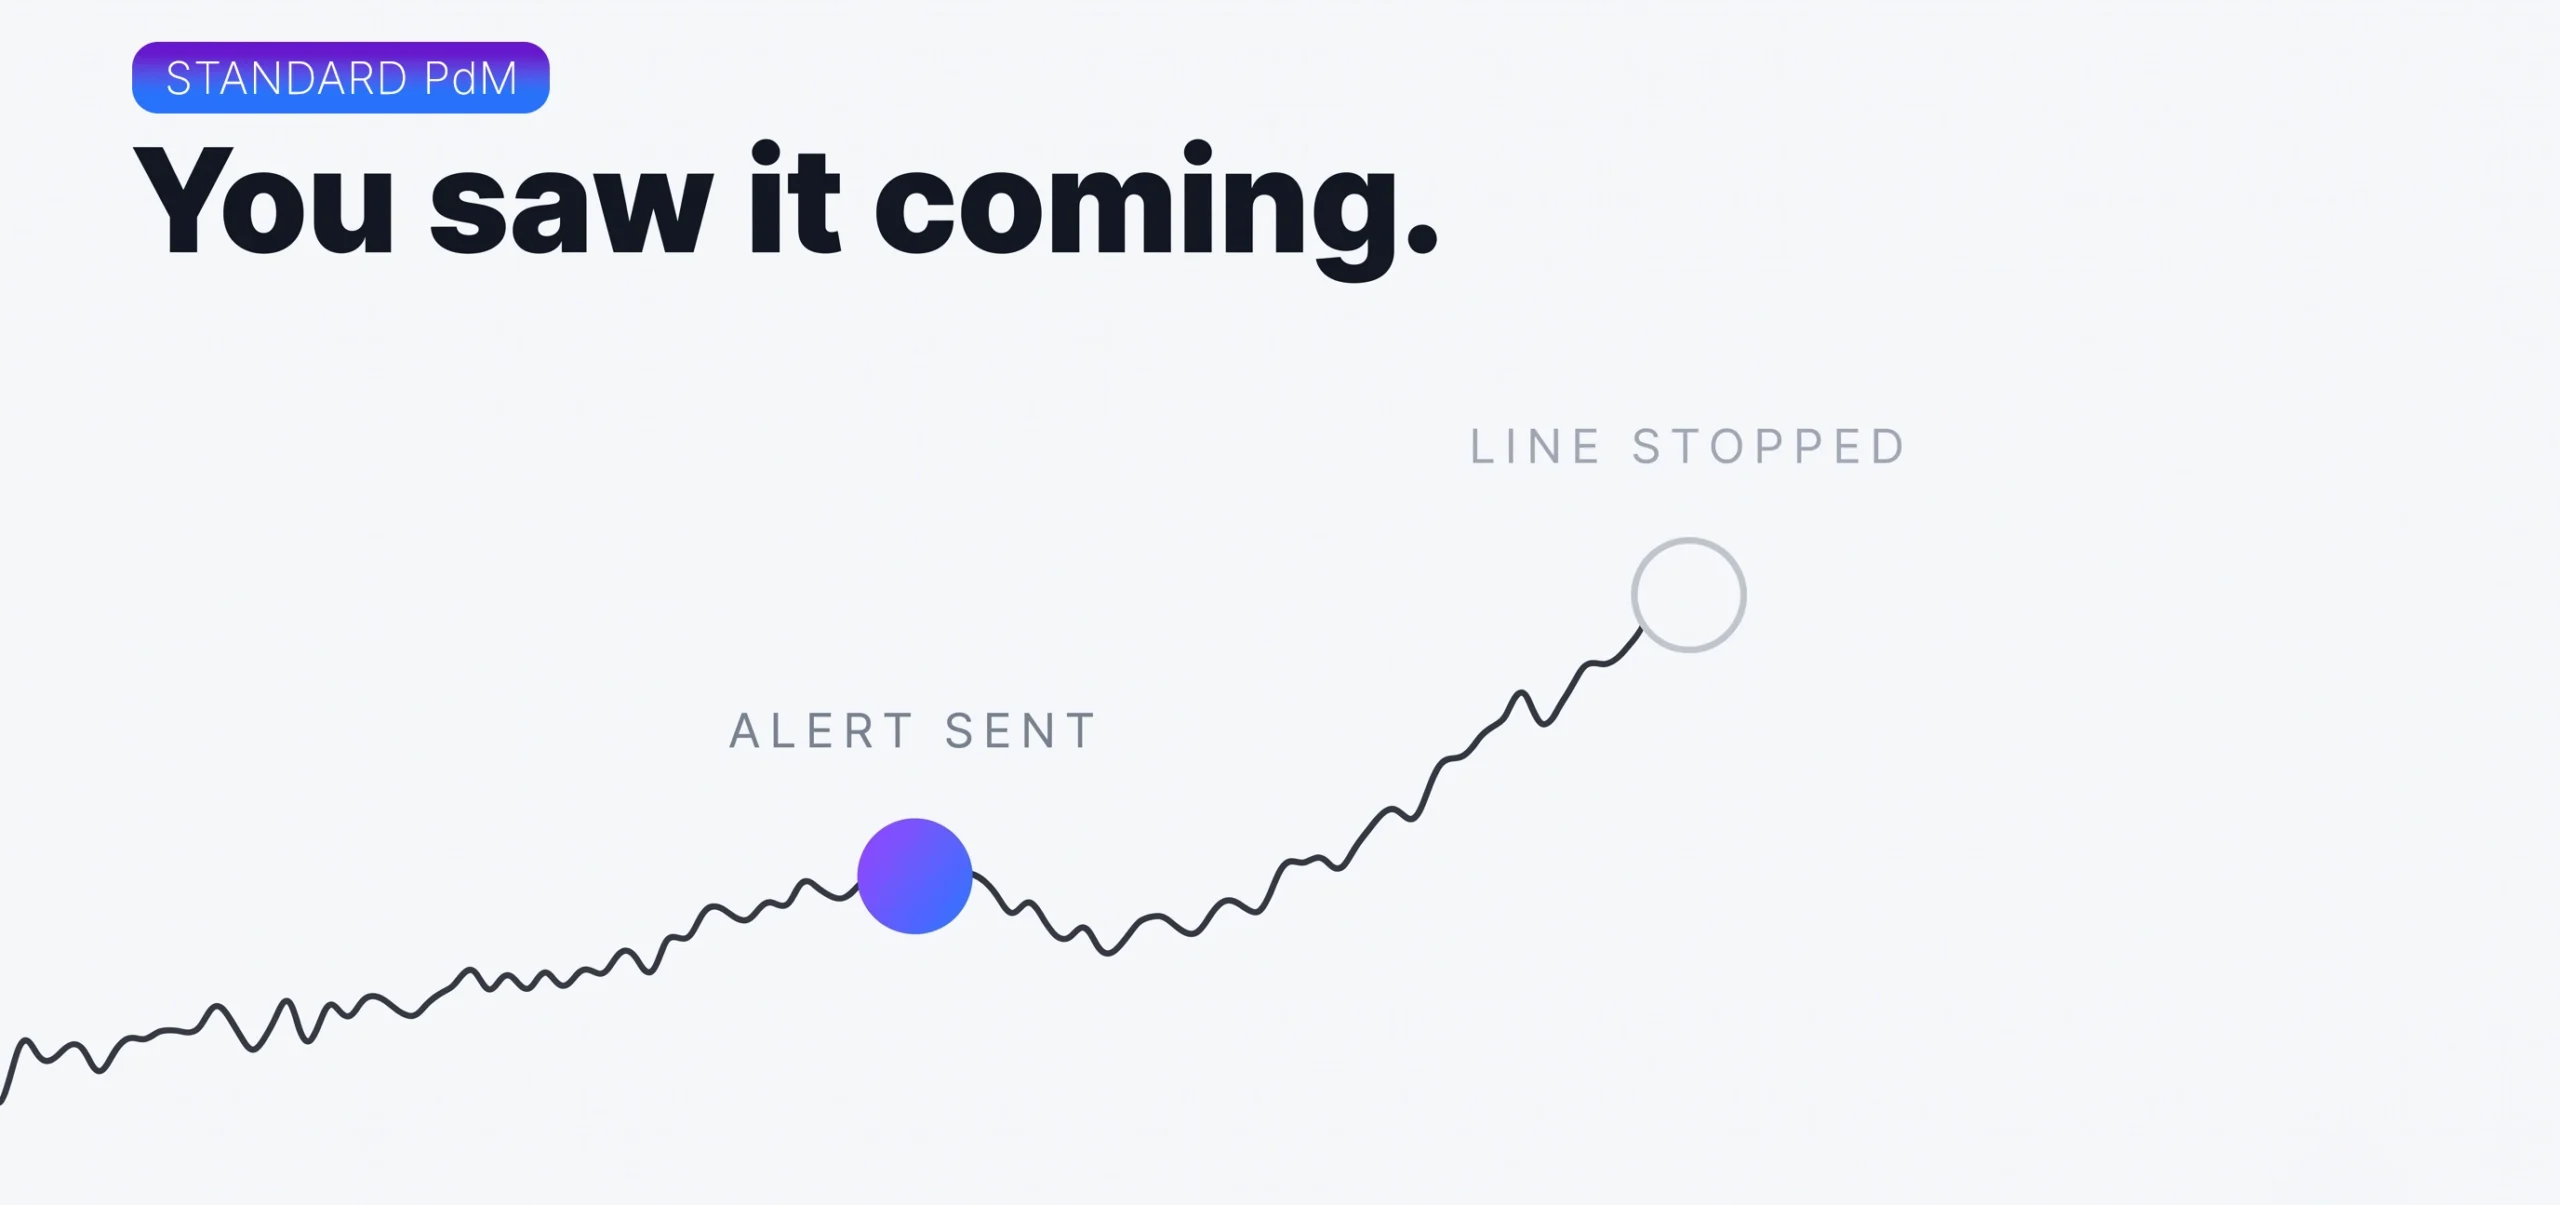
A predictive programme compresses the first interval and hands the other three back to your team. That is why plants with mature sensor coverage still report breakdowns. Detection was never the bottleneck. Everything downstream of it was.
1. It reads the process, so the diagnosis does not stall
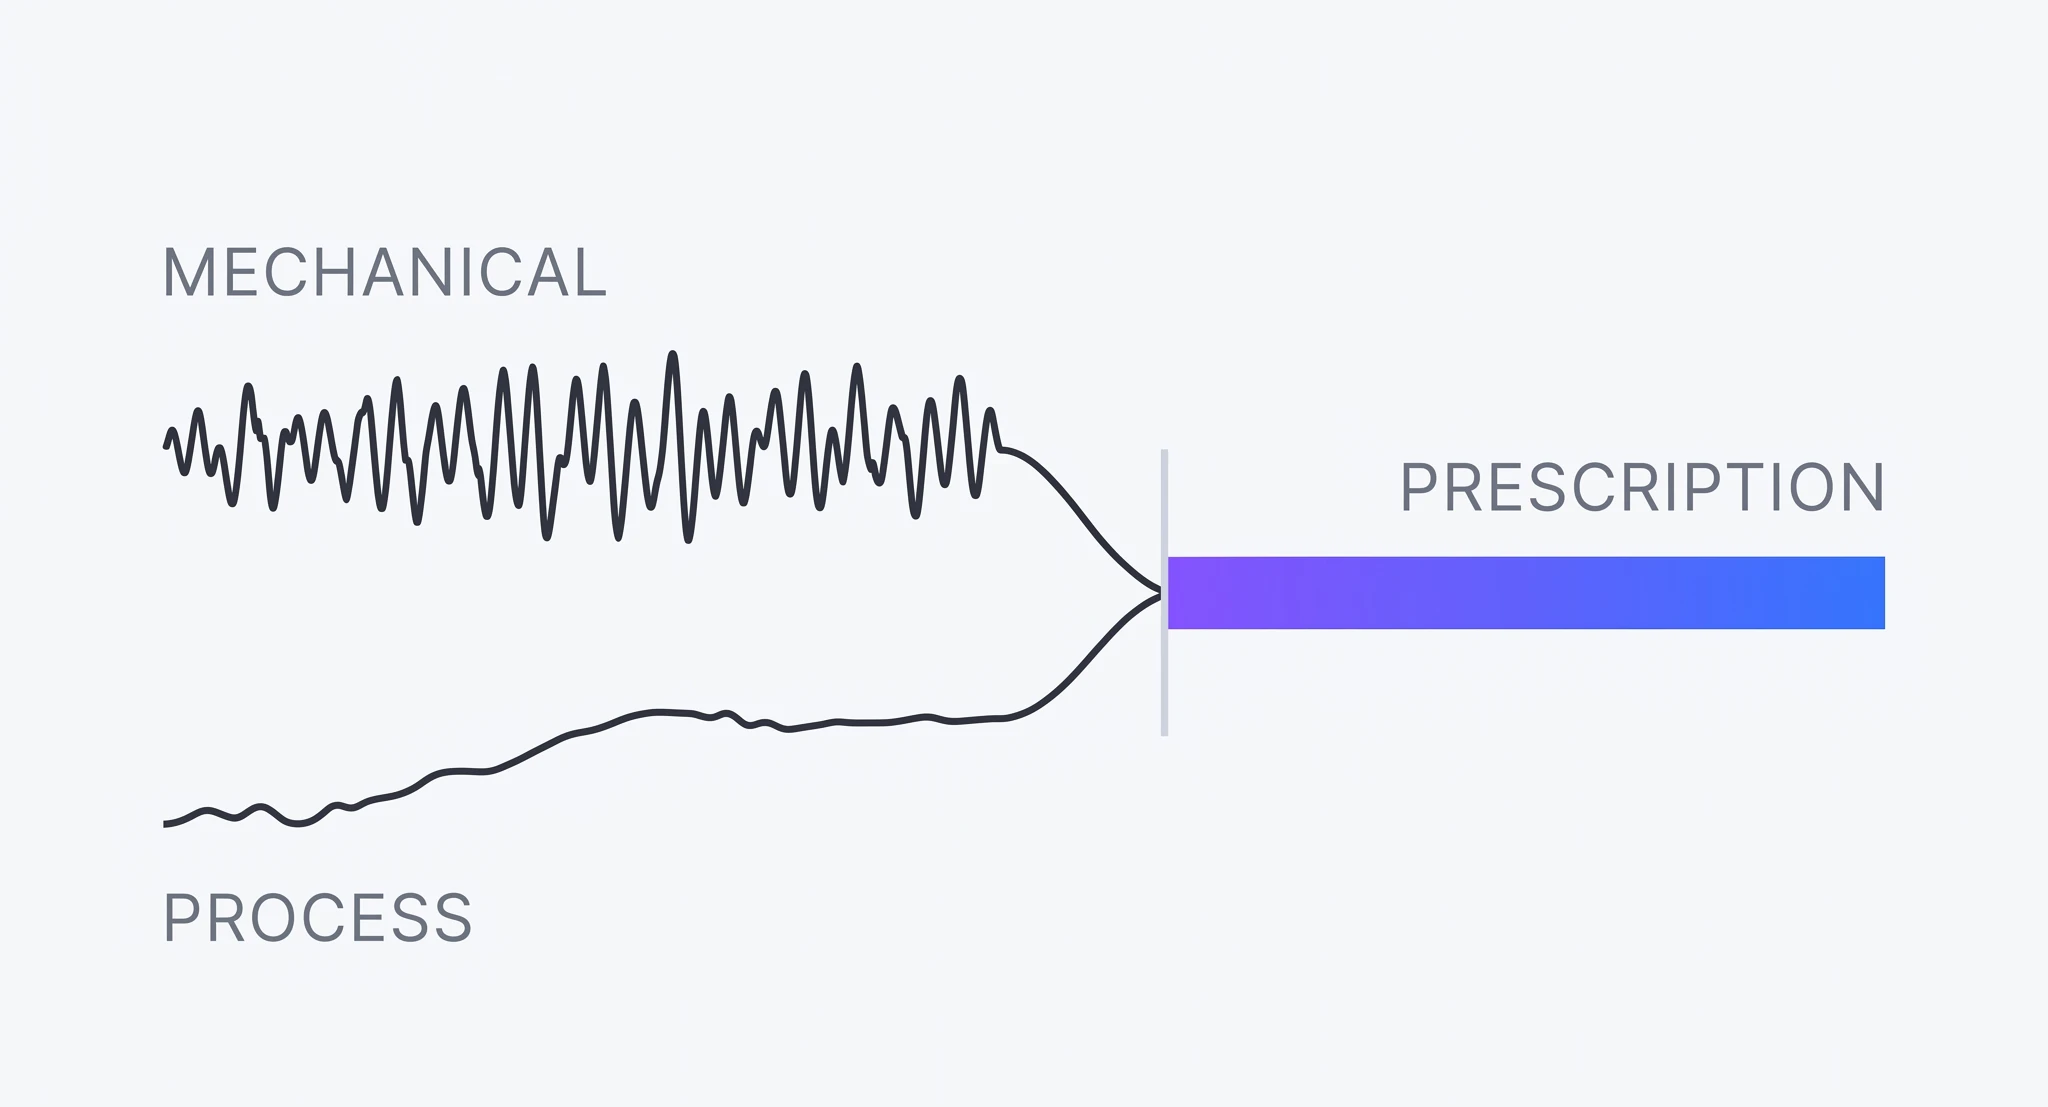
Mechanical fault signatures explain only part of what actually fails on a heavy plant. A large share of mechanical damage is induced from outside the machine by kiln ring formation, thermal overstress, cyclone coating buildup, ladle heat profile drift, or web tension drift. These conditions degrade the asset well before a clean mechanical signature appears.
Prescriptive AI contextualizes equipment data alongside process data from the PLC and historian. The fault is explained by its cause rather than described by its symptom, which is what allows a diagnosis to be issued automatically instead of queued for interpretation. Diagnosis lag drops from days to the length of a shift handover.
2. It names the fault mode, so the right job gets raised
A general anomaly model finds deviation on a mill. An equipment-specific model names gear-mesh backlash and links it to the load condition that caused it. That distinction decides whether the resulting work order fixes the failure or replaces a healthy component while the real fault keeps developing.
Infinite Uptime’s PlantOS™ delivers this through AI Shields, equipment-specific models built on Dynamic FMEA for kilns, mills, cranes, furnaces, mixers, extruders and dryers. Naming the fault mode removes the rework loop, and rework is downtime counted twice.
3. It ranks by production impact, so the critical line is defended first
Alarm severity tells you how sick an asset is. It does not tell you what stopping that asset costs. A moderate fault on a single-line kiln outranks a severe fault on a redundant pump every time, and most maintenance backlogs are not sorted that way.
Prescriptive AI ranks every open prescription by urgency and production impact, so the daily queue reflects tonnes at risk rather than decibels. Decision lag collapses because the argument about sequencing has already been settled by the data.
4. It ends at a work order, so the fix actually happens
This is where most deployments quietly stall. The insight lives in one system and the maintenance plan lives in another, with the translation depending on someone having a free afternoon.
A prescription reaches the operator on dashboard, email and mobile, carries a defined corrective action and a deadline, and is closed with a digital signoff. What the plant head opens in the morning is a prioritized daily queue instead of a risk chart. SPCC replaced reactive firefighting with exactly that queue and reported 9X ROI in under six months.
“Our team is no longer running from one breakdown to the next. We now start our day with a prioritized list from the system, telling us which machine needs attention. The system is amazing.”
Mr. Alaa Farrag, Maintenance Manager, SPCC
Anatomy of a prescription
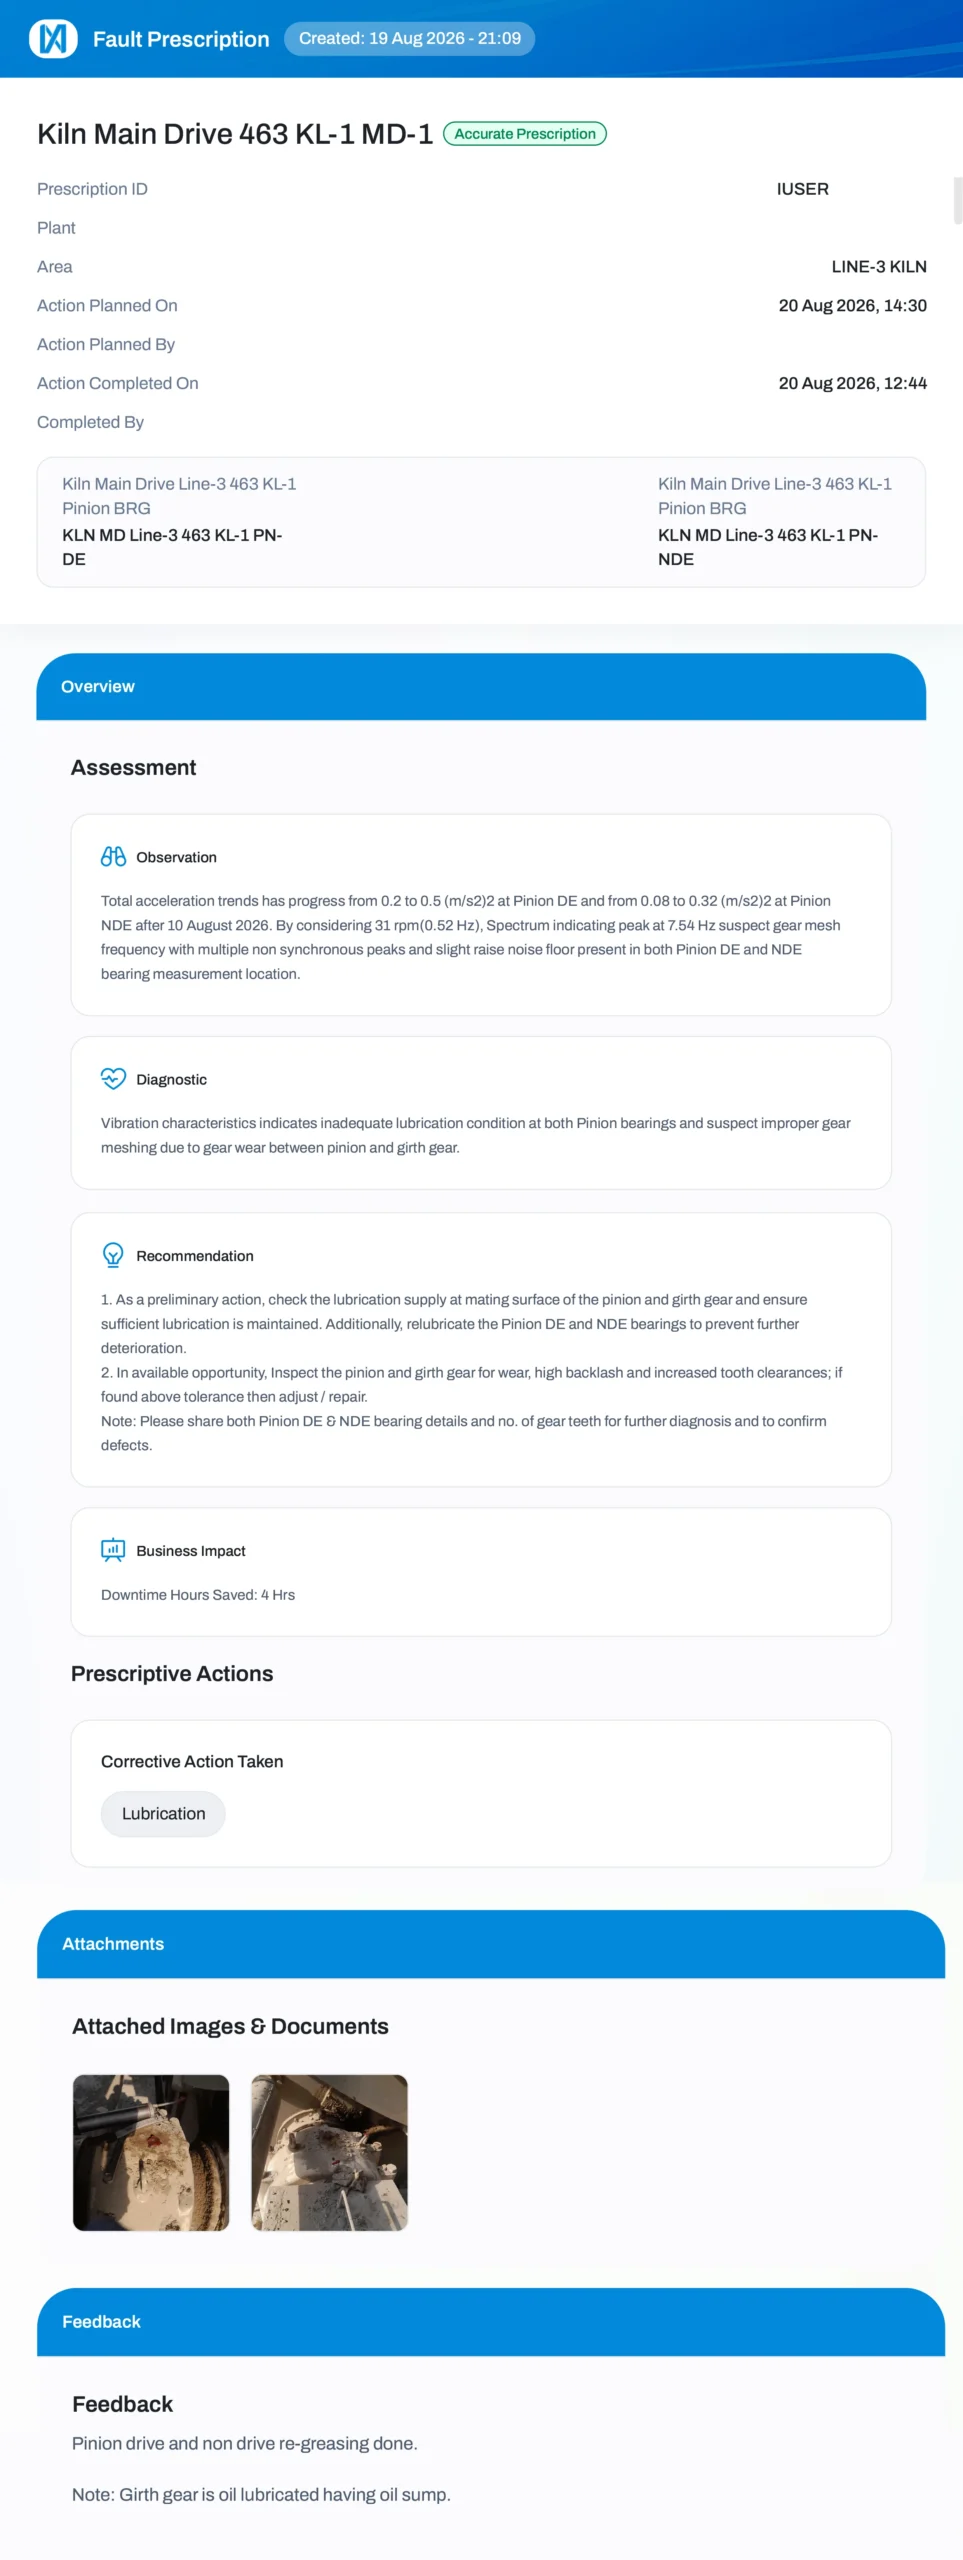
Everything described above arrives as one document. Below is a live prescription issued by PlantOS™ on a cement kiln main drive, closed by the plant’s own maintenance engineer.
-
1The header and the verdict
The document is titled a Fault Prescription, not an alert, and it carries a status chip reading Accurate Prescription. That chip is the plant's judgement on whether the diagnosis held, not the model's own. This is what accuracy measured by customer validation means in practice.
-
2The asset, down to the bearing
Not “kiln” but Kiln Main Drive Line-3 463 KL-1, monitored at the pinion bearing drive end and non-drive end. A generic model would report an anomaly on a kiln. An equipment-specific model knows the pinion and girth gear set exists and knows how it fails.
-
3The clock
Created 19 August at 21:09, planned for 20 August at 14:30, completed at 12:44 the same day. The decision lag and the execution lag are visible as timestamps, and the job closed ahead of its own window rather than waiting for the next shutdown. (Where the downtime hours actually go)
-
4Observation
Total acceleration climbing from 0.2 to 0.5 (m/s²)² at the drive end and 0.08 to 0.32 at the non-drive end after 10 August, with a spectral peak at 7.54 Hz read against a 31 rpm running speed. This is the part a predictive layer delivers on its own, and it is where most systems stop.
-
5Diagnostic
The step that usually waits for an analyst. Inadequate lubrication at both pinion bearings, with improper gear meshing suspected from wear between pinion and girth gear. The trend has become a named fault with a cause attached.
-
6Recommendation
Two actions in deliberate sequence. Restore lubrication at the pinion and girth gear mating surface and relubricate both bearings immediately, then inspect the gear set for wear, high backlash and tooth clearance at the next available opportunity. Immediate protection is separated from planned intervention, so the production plan is defended without calling a stoppage.
-
7Business impact
The prescription states its own value on the document at four hours of downtime saved, in the same view as the technical evidence. The number is not reconstructed afterwards for a quarterly review.
-
8Closure and feedback
Corrective Action Taken records lubrication as the work performed, with field photographs attached from the floor. Below that, the engineer writes back: pinion drive and non-drive end re-greasing done, with a note that the girth gear is oil lubricated and has an oil sump. That last line is plant knowledge the model did not have, entering the system through the person holding the grease gun.
One prescription, one asset, one shift. Repeat that across 1,000 plants and it becomes 167,837 hours of unplanned downtime saved.
5. It records the outcome, so next quarter is faster than this one
When an operator validates whether the prescribed fix was correct, that signoff becomes a labelled outcome, and labelled outcomes train sharper models. PlantOS™ formalizes this as the 99% Trust Loop: accuracy builds trust, trust drives action, action produces validated feedback, and feedback improves the next prescription. A prescriptive deployment is therefore worth more in year three than in year one, because the fault library is now built from your own assets.
What the compression is worth
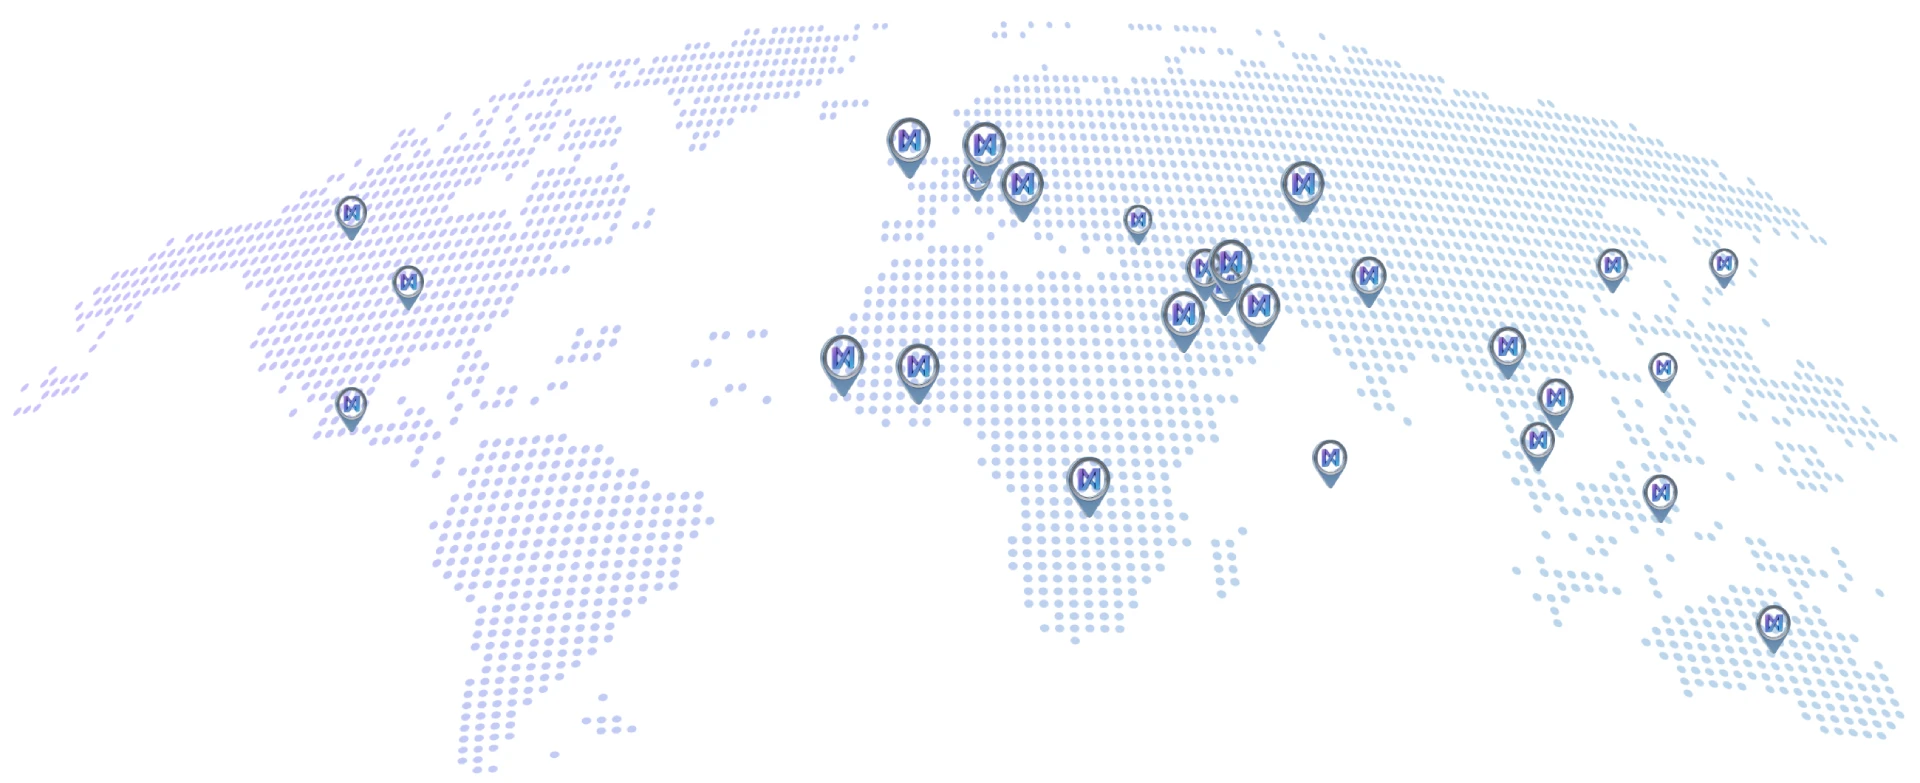
PlantOS™ is live across 1,000 plants in 28 countries, running at 99.97 % prediction accuracy with up to 99 % of prescriptions acted upon. Customers see up to 10 % lower maintenance cost and up to 2.5 % higher throughput, with every figure signed off by their own reliability and operations teams. Hindustan Zinc Ltd of Vedanta Group reported over $700K in savings as published by Vedanta Spark, while JSW Steel runs the platform across 139 plants and Coromandel International across 27.
Auditing your own downtime in one shift
Pull the last four unplanned stops on your most critical line and answer four questions.
Was the degradation visible in the data before the stop?
How many days passed between the first signal and a confirmed diagnosis?
Was the job ranked against production impact or against alarm severity?
Did the recommendation become a work order, and was the outcome recorded anywhere the model could learn from?
If detection was fine and the answers to the last three are uncomfortable, the plant does not have a sensing gap. It has an instruction gap.
Start with your most critical line. Try PlantOS™
Frequently Asked Questions
It reduces the time between a fault developing and a corrective job being completed. Prescriptive AI diagnoses the fault mode automatically, ranks it by production impact, issues a corrective action with a deadline to the operator, and records the signoff. Detection is only the first of four intervals that create downtime, and prescriptive maintenance solutions compress the remaining three.
Each prescription carries the observed trend and spectral evidence, a diagnostic naming the fault and its cause, a sequenced corrective action, a planned date, the operator who closed it, the corrective action actually performed, field photographs, written feedback from the floor, and the downtime hours saved. The example above shows a kiln main drive lubrication and gear wear fault closed inside sixteen hours for four hours of downtime saved.
Savings scale with production value per hour rather than asset count. Across the PlantOS™ install base, 167,837 hours of unplanned downtime have been saved, with customers reporting up to 10 % lower maintenance cost and up to 2.5 % higher throughput.
The first prescription is typically issued within two weeks of installation, with a structured 90-day path to measurable production outcomes. Self-powered wireless sensors install without gateways or plant cabling, so commissioning does not require a shutdown.
No. Prediction remains the detection engine, and Prescriptive AI adds diagnosis, prioritization, instruction and validation above it. Plants with existing sensor coverage and asset baselines usually reach value faster.
No. PlantOS™ operates alongside existing PLC, historian, SCADA and CMMS environments rather than displacing them, so the prescription lands inside the maintenance workflow your team already uses.
Track prescription action rate, which is the percentage of issued prescriptions executed on the floor, alongside mean time from signal to closure. A platform with high accuracy and a low action rate has an adoption problem rather than a modelling problem.