AI 4 Production Outcomes
Smart Technology, Smarter Outcomes
AI for Production Outcomes harnesses smart technology to optimize processes, minimize
downtime, and boost efficiency. It enables organizations to achieve measurable, smarter
outcomes with data-driven intelligence.


At Infinite Uptime, we don’t just use AI – we are AI. From the moment sensors capture data to the delivery of actionable insights, our entire ecosystem operates on AI 4 Production Outcomes.
Our collaborative, vertical-trained AI algorithms transform raw industrial data into production intelligence that drives real business impact.
We’ve pioneered this approach around a fundamental manufacturing truth: consistent value delivery outperforms the intermittent perfection solution.
It's about building reliable,
scalable intelligence that works every day
End-to-end AI integration across the entire value chain


Collaborative AI algorithms trained on industry-specific data


Focus on tangible production outcomes, not just insights

The Path to Value -
Our Value Delivery Stack
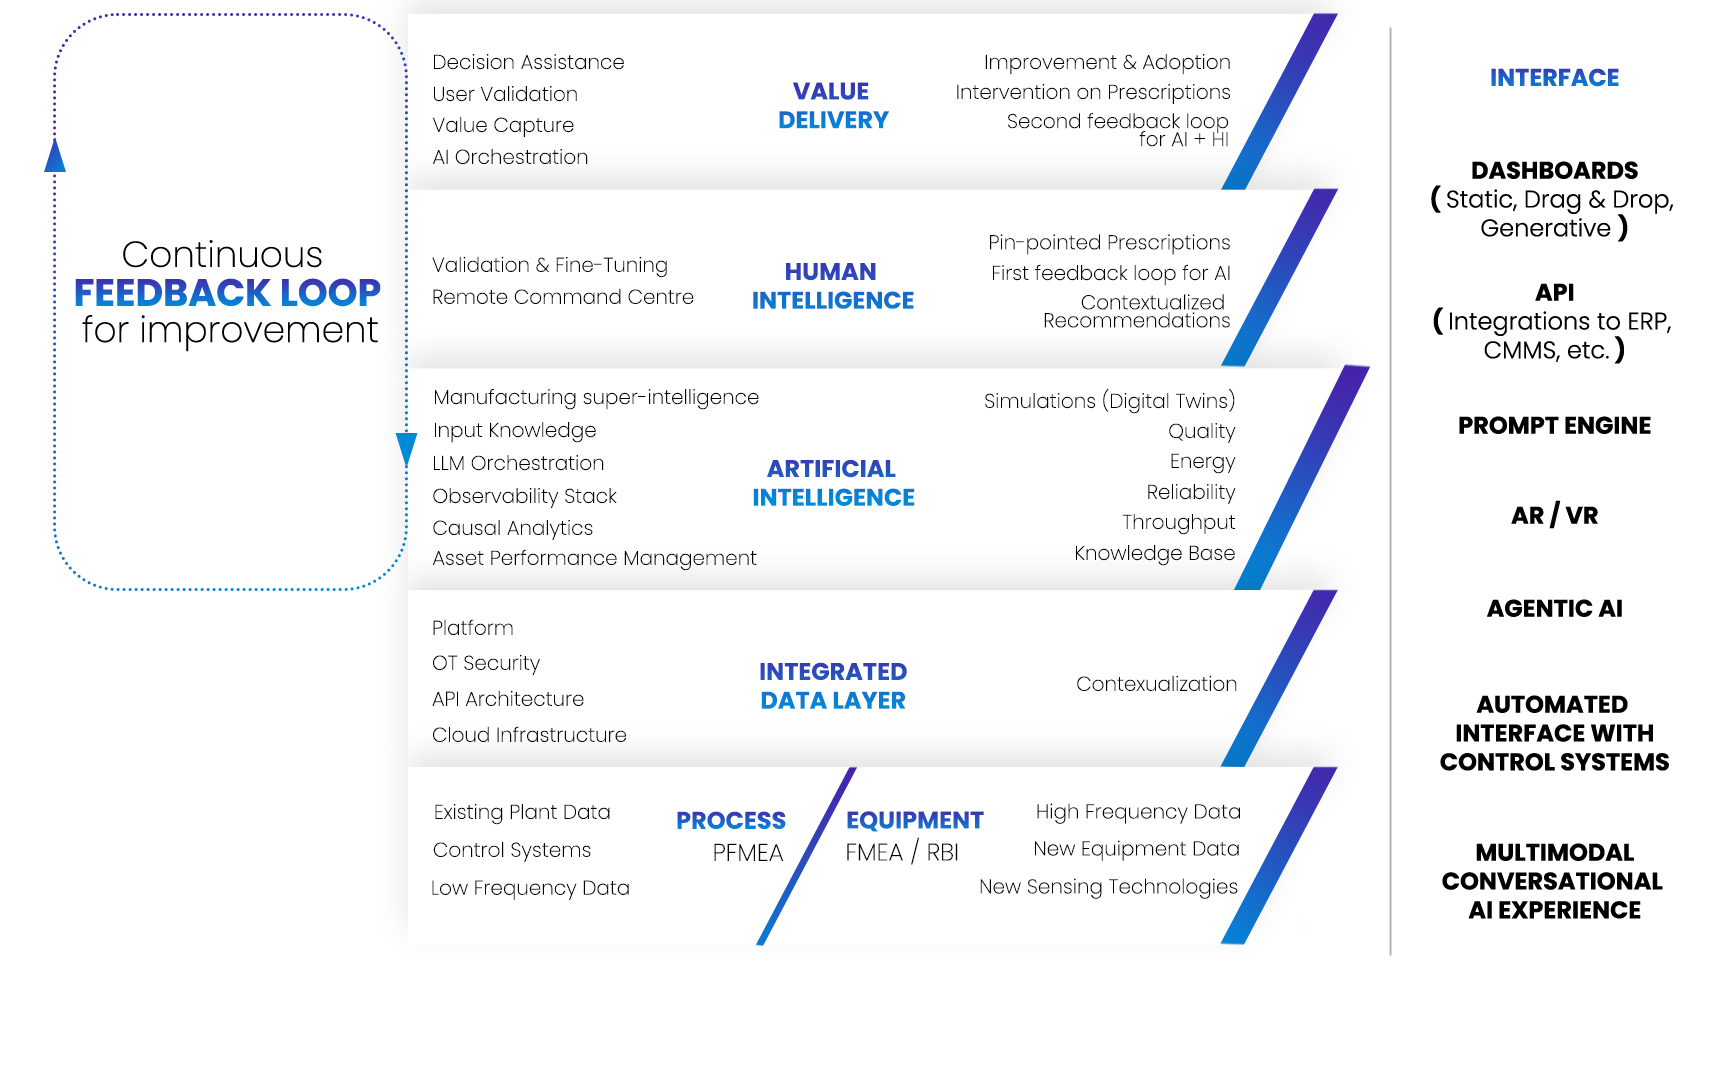
PlantOS™ Manufacturing Intelligence
Live Equipment & Live Process View
The Foundation Layer
- Continuous data (vibration analysis) and intermittent data (thermography, ultrasonic sensing, oil analysis) capture from mission-critical equipment & manufacturing processes
- Advanced sensing technology ingesting real-time data from critical rotating equipment
- Live process monitoring across a wide range of manufacturing processes
Integrated Data Platform
- Unified data repository gathering multi-source industrial information
- Context-rich data structuring for AI consumption
- Seamless integration across diverse equipment and process systems
Artificial Intelligence Engine
- Vertical-Specific Libraries
Asset behavior models unique to Vertical - Multi-Signal Correlation
Combines multi-parameter data across OT and IT systems to give pinpointed prescriptions - Unparalleled Diagnostics
Diagnostics on any equipment any process - Adaptive User-Validated Learning
Continuously improves accuracy over time and user-validation loop on every AI insight
Human Intelligence Interface
- AI-generated reports and prescriptive insights presented for human review
- Expert validation and contextual interpretation of AI recommendations
- Human-in-the-loop decision support and intervention points
- On demand Domain expertise combined with AI
Value Delivery & Decision Support
- Validated AI insights transformed into actionable decisions
- User-validation driving operational changes
- Measurable value capture and ROI tracking
- Strategic decision assistance powering production outcomes
Value Realization Across Every Persona
How Every Role Benefits
from AI 4 Production Outcomes
- Eliminate
- Reduce
- Raise
- Create
- Safeguard

Reduce
Conversion Cost per Unit Produced
Raise
Utilization Growth %
Safeguard
ROI / Value Creation per Unit Time per Unit Area

Reduce
Cost of Maintenance per Unit Produced
Raise
Safety & Risk Management
Safeguard
ROI / Production Agility

Reduce
Digital Tool Scatter / Integration Complexity
Create
AI-driven Site-wise Dashboards + Schedules
Safeguard
ROI-centric Digital Transformation

Raise
Output Growth %
Create
% Decisions Based on AI Prescriptions
Safeguard
Cost Competitiveness

Eliminate
Unscheduled Downtime Hours
Create
% AI Prescriptions Accepted & Acted Upon
Safeguard
Asset Reliability

Reduce
Cost of Energy per Unit Produced
Safeguard
Energy Efficiency

